Atmospheric water vapor plays a key role in weather forecasting for conditions like droughts, heavy precipitation, fog, and tornado-spawning storms. Because water vapor causes radio waves to be delayed as they are transmitted through the atmosphere, GPS stations can inform scientists about the amount of water vapor in the atmosphere.
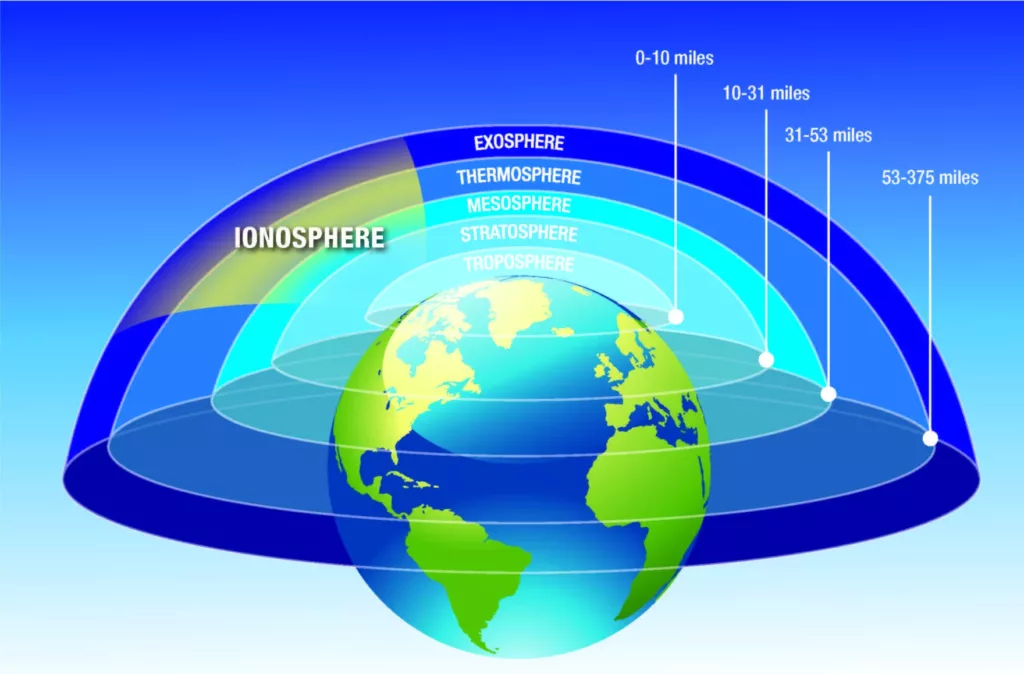
GPS (and other GNSS) satellites send signals that travel through Earth’s atmosphere to reach receivers on the surface. The signals experience delays from both the ionosphere and the troposphere. The ionosphere, which is a layer of Earth’s upper atmosphere that contains many charged ions, has a dispersive effect on the signal that can cause errors of meters to tens of meters in GPS location. The wave propagation speed depends on the frequency, meaning different signal frequencies experience different amounts of delay. Because GPS satellites transmit on multiple frequencies, the ionospheric impacts on GPS data can be corrected by examining the difference between them.
After the ionospheric effects have been removed, the GPS data will only suffer from the delay in signal due to the troposphere. These delays can still cause errors of approximately 2 meters in GPS location. The dry gas component of the atmosphere causes approximately 90% of this delay; however, the wet component responsible for the other 10% is the only part that varies significantly over time and by location. It can therefore be isolated to determine the amount of water vapor present in the atmosphere above the receiver.
Radiosondes, which are small instruments that are attached to hydrogen- or helium-filled weather balloons, can measure pressure, temperature, and relative humidity in a vertical profile of the atmosphere. From these instruments, we know that over 90% of water vapor is found in the 5 kilometers of atmosphere closest to Earth’s surface. While effective, radiosondes are expensive to launch and each one can only measure a single profile in a single location—although that does provide information about differences in water vapor at different altitudes. They are also unable to operate in hazardous weather conditions, like heavy rain or thunderstorms.
Satellites are also used to measure the water vapor in the atmosphere, and use different wavelengths varying from microwave to thermal infrared to near-infrared to visible. Some of these satellites include Terra, Aqua, and the MetOp satellites. While these instruments are able to cover a much larger area than ground-based measurements, they are limited by how frequently they pass over each location and can struggle to record accurate information in cloudy weather conditions.
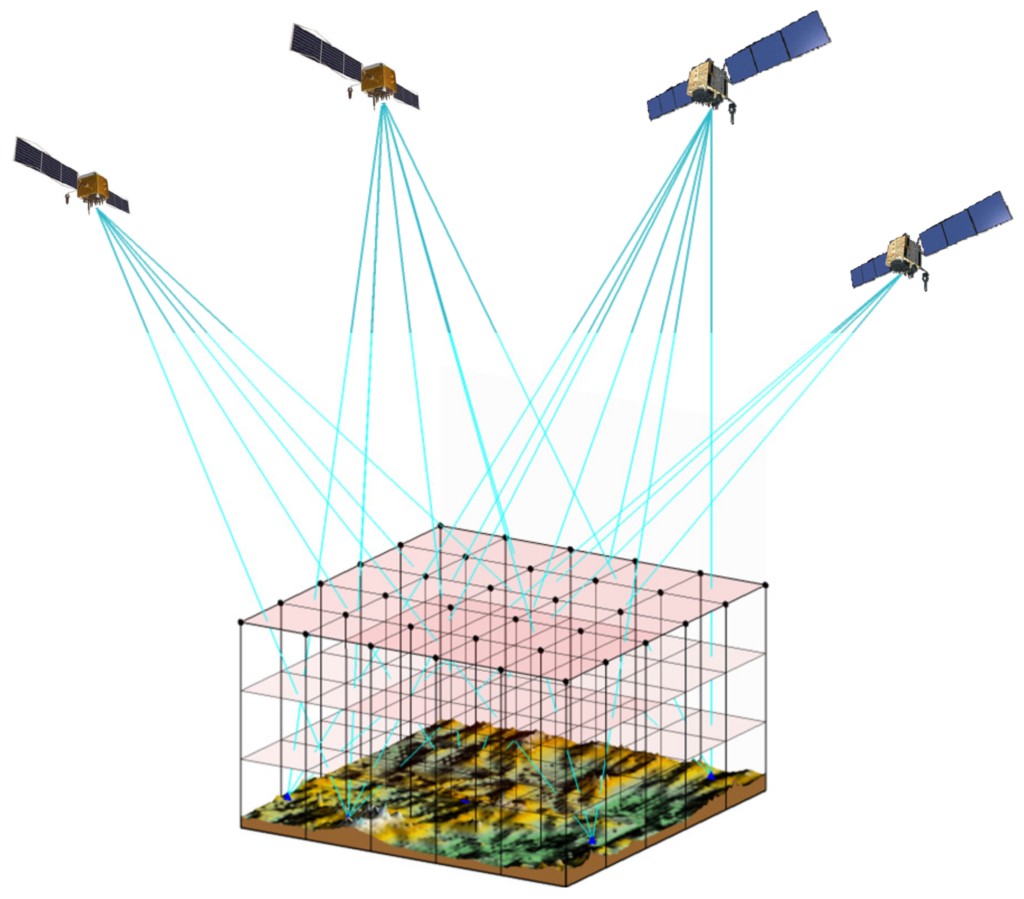
The concentration of water vapor in the atmosphere changes frequently—even from hour to hour. GPS stations can constantly measure the water vapor between them and each satellite passing overhead, averaged over timesteps of minutes to hours. The atmospheric signal delay along each path can be combined into a Total Zenith Delay (TZD), representing the equivalent delay for a purely vertical path above that station. By subtracting the dry gas component of this delay, we get the Zenith Wet Delay (ZWD).Given some information about temperature and air pressure, the Zenith Wet Delay can then be converted into Integrated Water Vapor (IWV)—the total amount of water vapor in the atmosphere above the station.
Weather forecast models, like those operated by NOAA and the National Centers for Environmental Prediction, rely on the intake (or “assimilation”) of as much data as possible. They use this data to generate an accurate representation of the latest weather conditions, and then simulate forward to forecast changing conditions in the following hours and days. NOAA’s Rapid Refresh model, for example, obtains the latest data each hour. One type of data it incorporates is integrated water vapor from GPS stations.
GPS-derived water vapor can also be used to monitor natural disasters, like the Southern California Summer Monsoon. In 2013, 37 new GPS stations were installed in Southern California as part of NOAA’s GPS-Met Analysis. In July of 2013, the North American Monsoon brought intense rainfall and flash flooding to Southern California. GPS water vapor data were analyzed every few hours to help detect sudden atmospheric moisture increases. These data informed the timing of flood watches, debris flow and flash flood warnings, and necessary road closures.
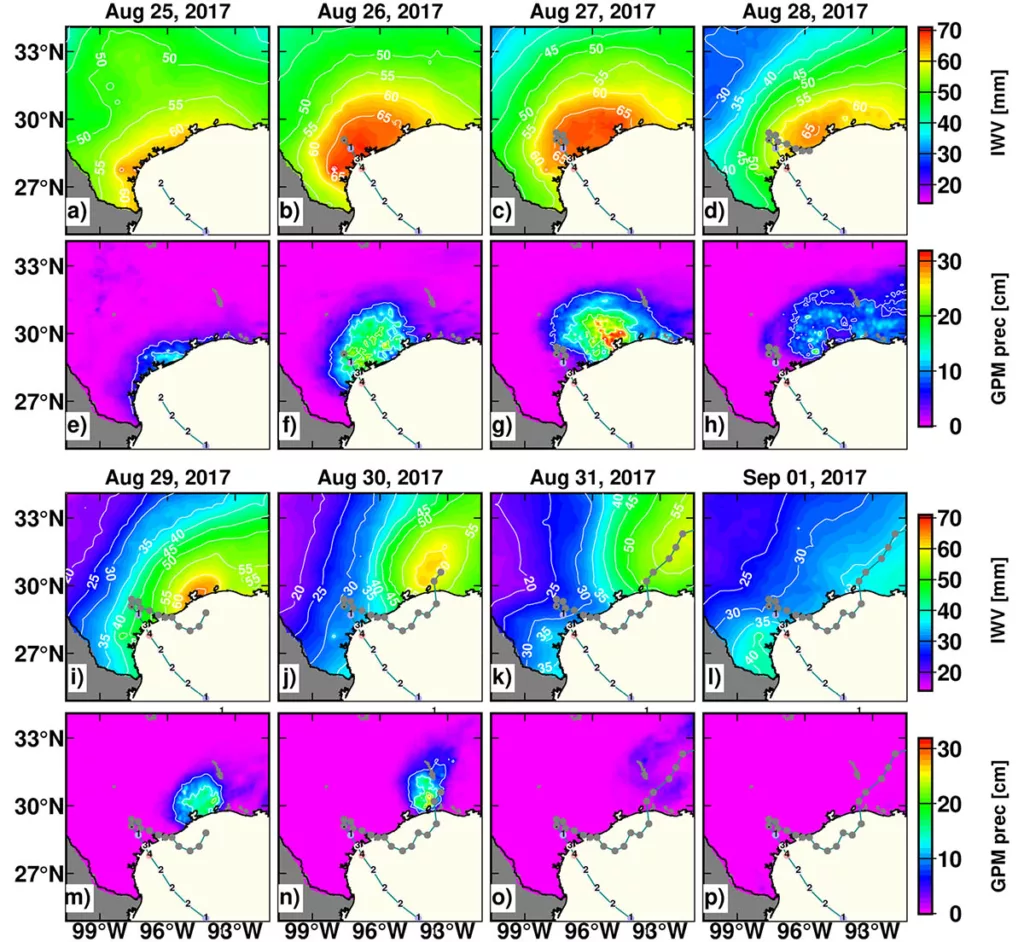
The same approach could be used to help improve hurricane rainfall forecasts. For example, a 2021 study found that GPS stations near the Gulf Coast could have been used to forecast precipitation and overland movement of Hurricanes Harvey and Irma in 2017.