Understanding ground deformation as a precursor to a volcanic eruption is essential for forecasting eruptions and generating hazard warnings. GNSS is a useful tool to measure how the surface of a volcano changes due to movement underneath as magma and other fluids move through pipes and conduits. Data from continuously recording instruments can reveal three-dimensional displacements of the ground surface with millimeter-scale precision.
As the magma system within a volcano changes, the shape of the volcano also adjusts. If magma enters the system or releases gas, it becomes pressurized. The ground above becomes inflated like a balloon, moving upward and outward. Similarly, if magma leaves the system or fluid pressures decrease, the volcano “deflates” and moves downward and inward. This surface deformation can inform geoscientists about how the magma inside a volcano is behaving.
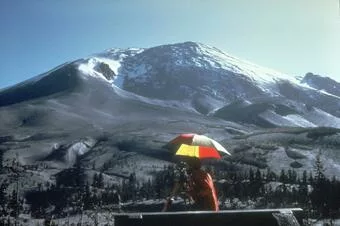
Mount St. Helens
For example, Washington’s Mount St. Helens volcano developed a bulge on its north side in early 1980. By the end of March, the bulge was increasing in size by nearly two meters daily, exceeding 130 meters by May 17. Scientists understood that there was a high probability that Mount St. Helens was going to erupt, but they did not expect the volcano to erupt from its side the next day. Volcano deformation monitoring can help geoscientists understand how the magma is moving within a volcano and might inform them when an eruption is near. In the case of Mount St. Helens, monitoring of this deformation helped save countless lives and prepare for the forthcoming volcanic hazards.

Kīlauea
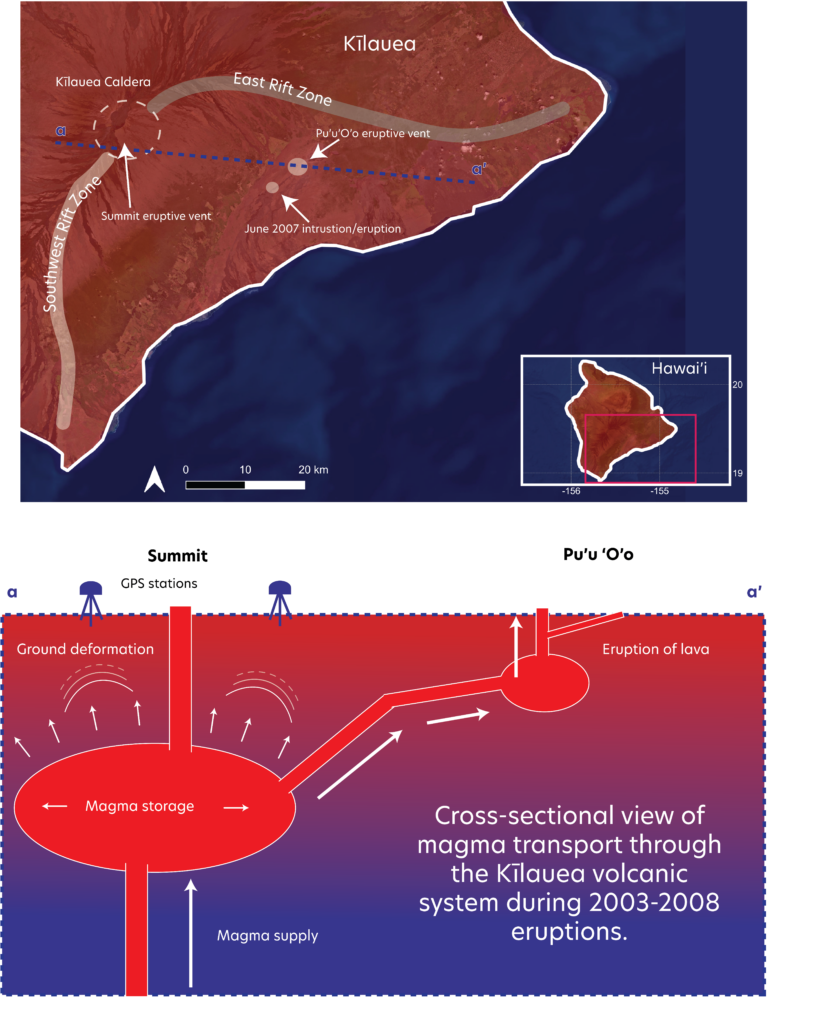
The rate of incoming magma supply beneath a volcano is a key factor to forecasting its eruptive activity. A 2012 study used GPS data, in addition to InSAR and gas chemistry, to estimate the rate of the magma supply in the Kīlauea volcano in Hawai’i from 2003-2007. The researchers determined that the rate more than doubled over that time period. GPS data revealed that in late 2003, the Kīlauea volcano was inflating under the caldera.
There was a short period of time in 2005 when the volcano deflated due to magma feeding into the Pu’u ‘Ō’ō vent to the east, which erupted lava. But after this eruption, the volcano continued to inflate in an area known as the Southwest Rift Zone. The increase in magma supply led to a small eruption from June 17-19, 2007, which resulted in the formation of a new Eastern Rift Zone vent on July 21, 2007. Then, on March 19, 2008, there was an explosive eruption from Halema’uma’u Crater inside Kīlauea’s caldera. After this eruption, the magma supply rates began to slow, returning to the pre-2003 rates.
This study helped scientists understand the plumbing system within the Kīlauea volcano and consider the connection between the Eastern Rift Zone and summit, increasing awareness of the potential risk for populations in the path of a lava flow coming from Pu’u ‘Ō’ō.

Mount Etna

Although longer term trends in displacement are useful for understanding volcanoes, the real-time GNSS information can also be extremely useful for understanding rapid changes in volcanic systems. For example, a 2015 study created a tool that tracks the contraction and expansion of volcanoes with real-time surface deformation data and is able to monitor the dynamics of magma movement in seconds.
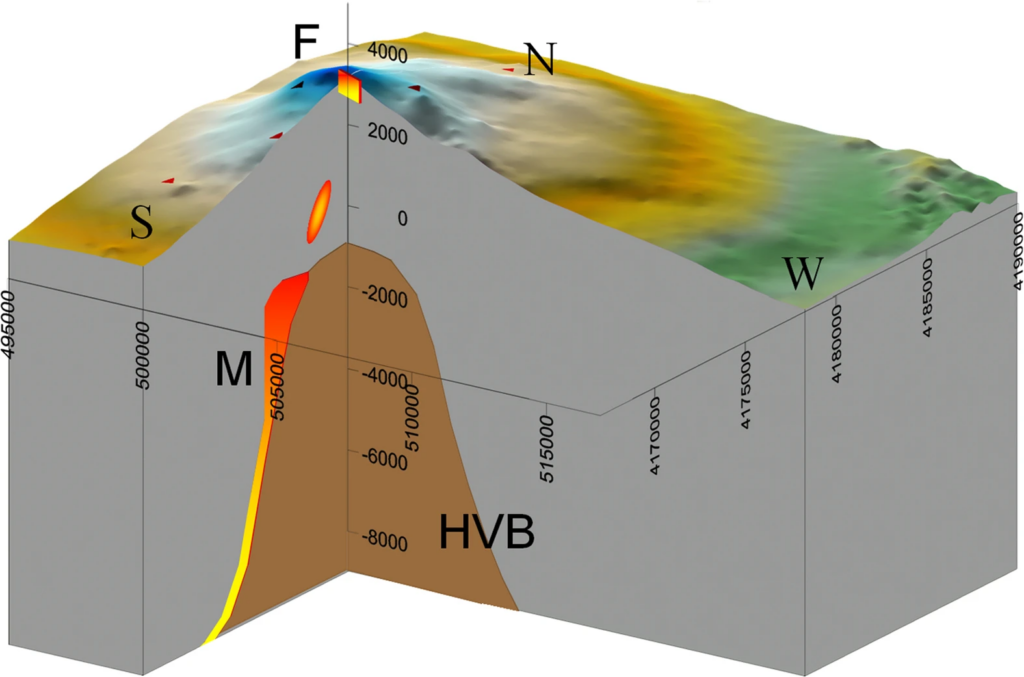
The team of researchers applied their tool to the 2008 Mount Etna eruption in Sicily, Italy as an example. Using GPS data from ten stations, the scientists simulated a real-time situation and monitored changes in the magma system for over a year prior to the eruption. This modeling displayed rising magma and a dike intrusion within Mount Etna, as well as the movement of magma towards the surface of the volcano the night before the eruption. The deformation data was used to track pressure changes throughout the morning of the eruption, which aligned with the location of the actual eruption fracture in Mount Etna. Techniques like this one may have helped scientists issue earlier warnings to the communities impacted by the eruption, especially by highlighting the likeliest location of the eruption.
Plumes
While GNSS provides both high-precision data that allow geoscientists to track volcano deformation, GNSS is not limited to providing only deformation information. A 2017 study found that GNSS signal to noise ratio (SNR) data can be used to detect ash plumes rising from Redoubt and Etna volcanoes. The researchers found that large pieces of ash affect the satellite signal reaching the GNSS station during volcanic eruptions, which results in a low signal to noise ratio. This technique even works with less expensive instruments than typical high-precision GNSS stations, so it could provide a real-time, relatively inexpensive method for monitoring the plumes of shorter eruptions.
From surface displacement to modeling magmatic movement to analyzing SNR data for plume detection, GNSS can be used in a variety of ways to understand more about complex volcanic systems and assist the communities that may be affected by eruptions.

