

Not all volcanoes erupt explosively. Magma, melted rock below the surface, is less dense than the surrounding solid rock. This density difference allows the magma to ascend through a volcano’s pipes and conduits to the surface. Along the way, it may pool in magma chambers where it crystallizes or builds in pressure.
Whether or not a volcano erupts explosively is dependent upon the composition of the magma. Gasses are easily able to escape thin, runny magma, so when an eruption occurs, the lava spills out of the volcano like in eruptions of Hawaii’s Mauna Loa. Lava flows like these move slowly, allowing people to evacuate before being injured.
On the other hand, gasses can become trapped in thick, sticky magmas. The pressure within the magma reservoir increases until the gasses violently explode in eruptions like Washington’s Mount St. Helens. The hazards don’t stop there. In explosive eruptions, ash is ejected into the atmosphere, where it can circulate and deposit vast distances from the volcano. Ash can be extremely harmful to aircraft by abrading parts of the outside of planes and clog essential parts of the engine. Ash can rain down from the sky, blanketing the environment with a layer thick enough to suffocate plants, animals, and people, and damaging infrastructure. If hot volcanic substances mix with water, ice, or snowmelt, mudflows known as lahars can form, creating a fast-changing hazardous scenario capable of destroying entire communities.
Volcanoes need to be monitored so that warnings for hazards like mudflows and lava flows can be issued to surrounding communities. The United States Geological Survey operates five volcano observatories around the country, each devoted to volcano monitoring and research in specific geographic regions: Alaska Volcano Observatory, California Volcano Observatory, Cascades Volcano Observatory, Hawaiian Volcano Observatory, and Yellowstone Volcano Observatory. How do these observatories monitor volcano hazards, though?
Volcano monitoring consists of a variety of methods, including earthquake detection, ground deformation measurements, rock and water chemistry, and volcanic gas analyses. All these measurements can be used to keep track of how a volcano’s magma is moving beneath the surface. While volcanoes are complex systems that exhibit unpredictable behaviors, better understanding and modeling the physics behind volcanic eruptions and monitoring of volcanic trends and behaviors has allowed scientists to forecast volcanic eruptions with geodetic and seismic methods. Even recently, applying machine learning to volcanic seismic data has led to advances in new detection techniques.
As magma rises to the surface, it disturbs the surrounding rock. The changes in stress distribution and pressure frequently cause fracturing, leading to small but detectable earthquakes. While normal magma movement will result in background seismic activity, earthquakes larger than this background noise may be one of the first indicators of a potential eruption. These precursors are usually shallow (within 10 km of the surface), small in magnitude, and can occur in swarms of dozens to hundreds of seismic events. Seismologists are also able to further constrain the type of volcanic activity based on the earthquake signal:
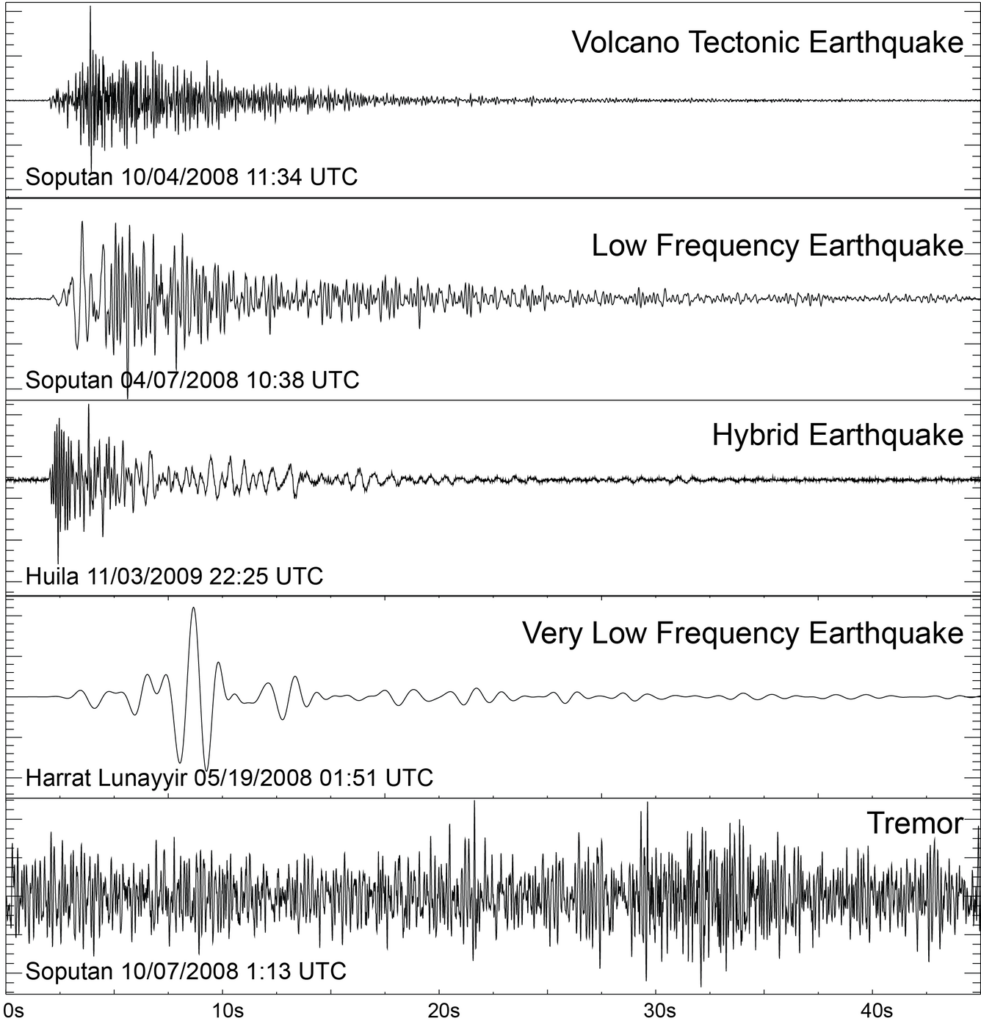
- Volcano-Tectonic Earthquakes: Representative of brittle failure of rock, these events can happen because of changing stresses as magma and fluids move through pre-existing cracks in the rock. These processes are complicated and usually need additional geodetic, geochemical, and hydrologic data to be understood.
- Long-Period (or Low-Frequency) Earthquakes: Often detected prior to an eruption, these events are due to cracks in the rock resonating when magma and gas ascend. These events are also part of normal background seismic activity and can be caused by non-magmatic processes, such as glacial movement.
- Tremor: These high-amplitude signals can be caused by continuous volcano-tectonic or long-period/low-frequency events, explosions, or enduring resonance from long-lived magma movement through cracks in the rock.
For example, when Mount Redoubt in Alaska erupted in 1989-1990, warnings were issued in advance of the two explosions because of 11 swarms of precursor earthquakes. Geoscientists analyzed the long-period seismic activity and deduced these swarms to be from movement of high pressure fluids traveling along fractures inside the volcano as the magma ascended to the surface. This precursor detection allowed advanced warnings to be issued prior to the volcano’s explosive eruptions.
Geodesy also helps us understand volcanic processes, such as eruption mechanisms or the internal plumbing system that magma may travel through. Geodetic data can be used to characterize times of volcanic unrest, leading to more accurate hazard assessments. In addition to seismic activity, geoscientists can also measure ground deformation for volcano forecasting. Ground deformation, caused by movement of magma through cracks and faults, can be measured earlier than other indicators, like seismic activity (which does not occur until a strain threshold is reached).
Ground deformation can also be caused by other processes, like tectonic motion or geothermal activity, so it’s important to measure how the surface is changing. Ground inflation is often observed prior to eruption as the magma has risen to the surface and is pressurized. GPS and InSAR are both methods that are useful for ground deformation monitoring, and help forecast volcanic eruptions. Borehole strainmeters are also helpful for measuring ground deformation because they are so sensitive. The 1991 Hekla, Iceland eruption was monitored with data from five borehole strainmeters. This information allowed scientists to relatively accurately predict the timing of the 2000 Hekla eruption: geoscientists predicted the eruption would begin in 15 minutes based on precursor earthquakes.
Chemical analyses of volcanic gasses can also be used to monitor when an eruption may be on the horizon. As magma rises, it depressurizes much like a can of soda fizzes once the seal is cracked. This process releases specific types of gas, like carbon dioxide, sulfur dioxide, and water vapor. When detected by scientists at the surface, it can mean the volcano is becoming active.
However, high temperature and hazardous environments makes reliable data collection from fumaroles difficult. Luckily, remote sensing techniques can be used to monitor these variations in gas emissions with cameras that measure very specific wavelengths of light.
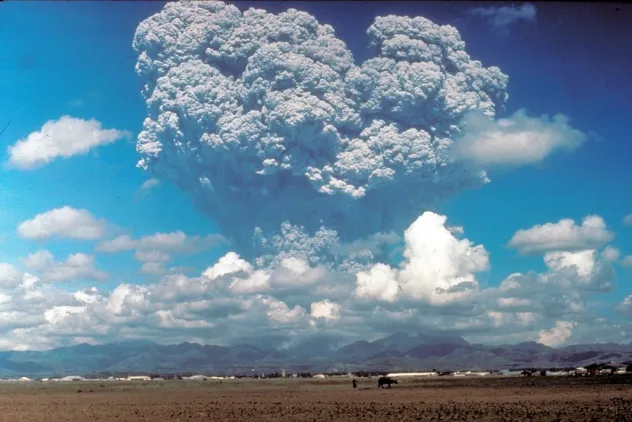
Changes in sulfur dioxide and carbon dioxide gas fluxes at volcanoes have been used to indicate magma activity that may be indicative of a forthcoming eruption. For example, high concentrations of sulfur dioxide gas at Mount Pinatubo in 1991 indicated that the ground deformation activity was not related to geothermal activity, but instead magmatic unrest. In early June 1991, there was a decrease in sulfur dioxide flux, indicating that the volcano was sealing. This caused increased pressure and made the conditions ripe for an explosive eruption (the second largest in the 20th century), which then occurred on June 15.
Volcanoes are complex systems, and having a plethora of techniques at the ready to monitor their behavior is key to accurate and timely forecasting. Part of the formula is keeping the public aware and engaged with volcanic hazards. The Smithsonian Institution’s Global Volcano Program operates a weekly volcanic activity report, allowing curious viewers the opportunity to see where in the world new eruptions and activity are being monitored. While still a developing field, monitoring and forecasting of volcanic eruptions are improving with the integration of more sensitive instruments, ground-based and remote sensing techniques, and the flourishing of machine learning for data processing.