

Solid Earth science encompasses many processes occurring across Earth’s crust: earthquakes, volcanoes, landslides, and areas of geothermal energy production. InSAR has been used to study solid Earth processes since its inception in the 1990s, and the applications have only continued to grow. Below are a few examples of InSAR’s applications to these various hazards.
Earthquakes
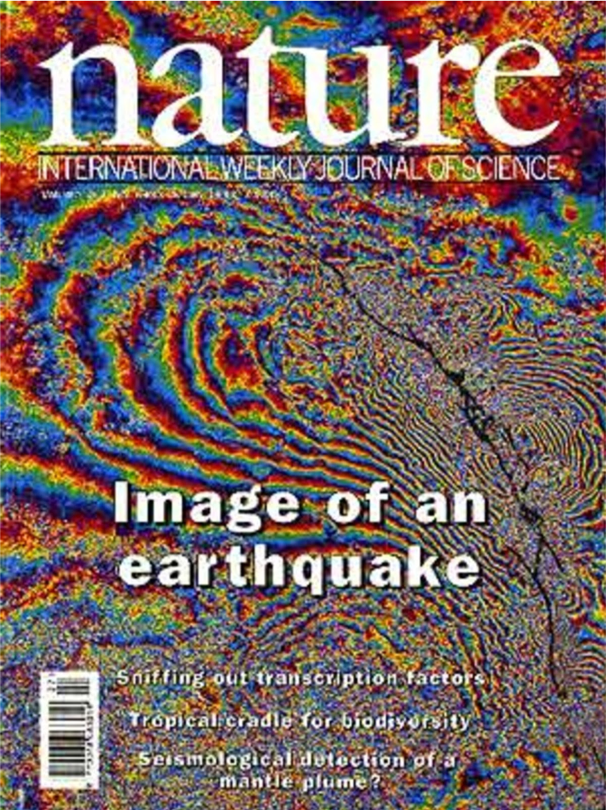
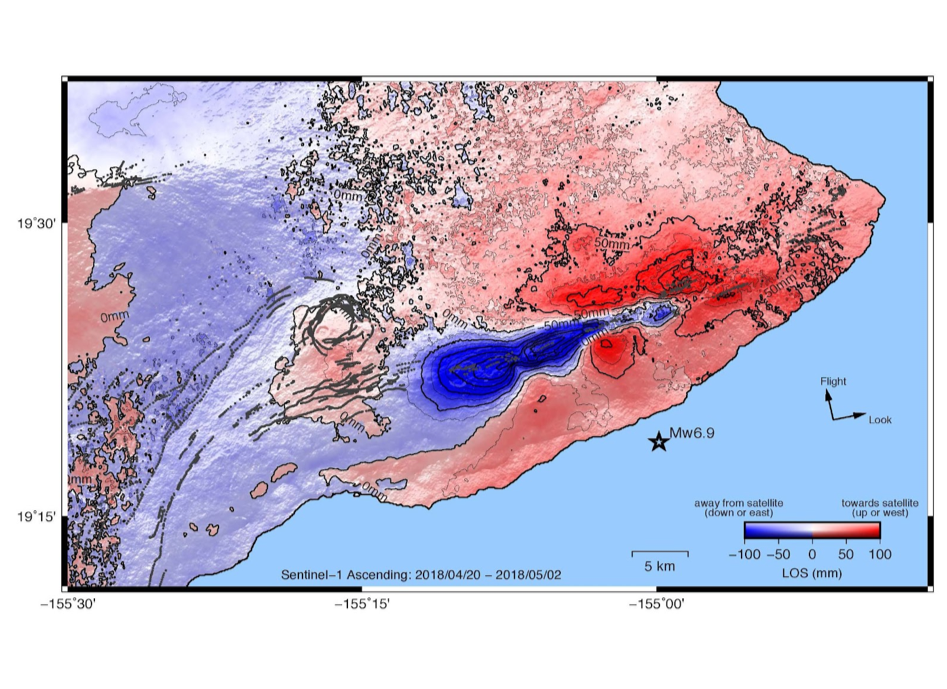
Interferogram pairs that contain dates before and after earthquakes can show the amount of displacement that occurred due to fault movement. In fact, the image below from the cover of Nature shows one of the first implementations of an interferogram in this way, to study the June 28, 1992 Landers earthquake. For this interferogram, two ERS images acquired on April 24th and August 7th, 1992 were used to compare the ground before and after the earthquake. Now with satellites that have revisit times cut down to half or less of the ERS 35-day revisit period, deformation from earthquakes can be further isolated as dates closer to the event can be selected and compared.
Once the capability to produce InSAR time series from multiple interferograms was introduced, it became possible to capture long-term deformation over wide areas. In the case of earthquakes, this meant that pre-seismic, co-seismic, and post-seismic deformation was available as long as there were enough SAR acquisitions over the earthquake’s location.
Volcanoes
Another use for both InSAR pairs and time series is measuring deformation occurring at and around volcanoes. When there is an injection of magma beneath the surface, this often leads to different ground deformation patterns. An increase in pressure in a magma chamber can lead to a radial uplift pattern on the surface above, while a dike injection can often cause a combination of uplift and subsidence. An InSAR pair with dates spanning before and after the magma movement can be used to quantify the amount of associated ground deformation.
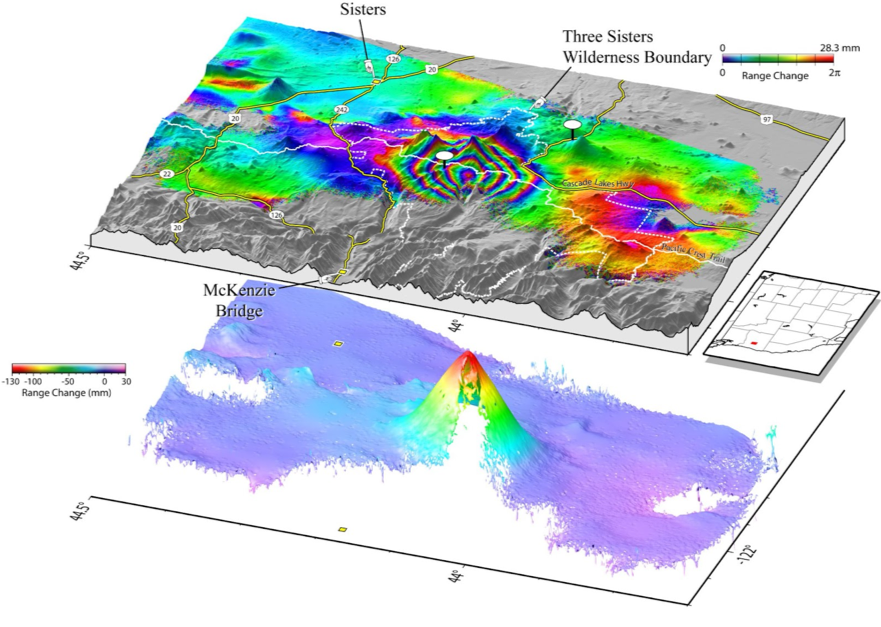
InSAR time series can also be used to quantify long term deformation at volcanic systems, such as subsidence from cooling lava flows or cyclic uplift and subsidence associated with magma movement unrelated to eruptive activity.
Landslides
The spatial coverage of InSAR has also proved beneficial for landslide mapping over wide areas that are hard to inspect otherwise. InSAR is not used in its traditional fashion for studying landslides because the amount of deformation during a landslide is often too great of magnitude and too fast. This leads to images where the area impacted by the landslide appears decorrelated. However, there are still creative opportunities to use the technique. Current studies are analyzing this decorrelation as a tool for mapping and are also using InSAR time series to find any present deformation that could indicate a landslide might occur in the near future.