Earth’s hydrosphere is composed of all water stored on the surface of the Earth in surface water (oceans, lakes, rivers, etc.) as well as groundwater beneath the surface. Understanding changes in the hydrosphere in response to human activity and changing weather patterns is critical for determining how much water will be available in different regions of the world. InSAR’s ability to measure ground deformation can be particularly useful for detecting groundwater changes, while surface water hazards such as floods can also be monitored with SAR data over time.
Groundwater
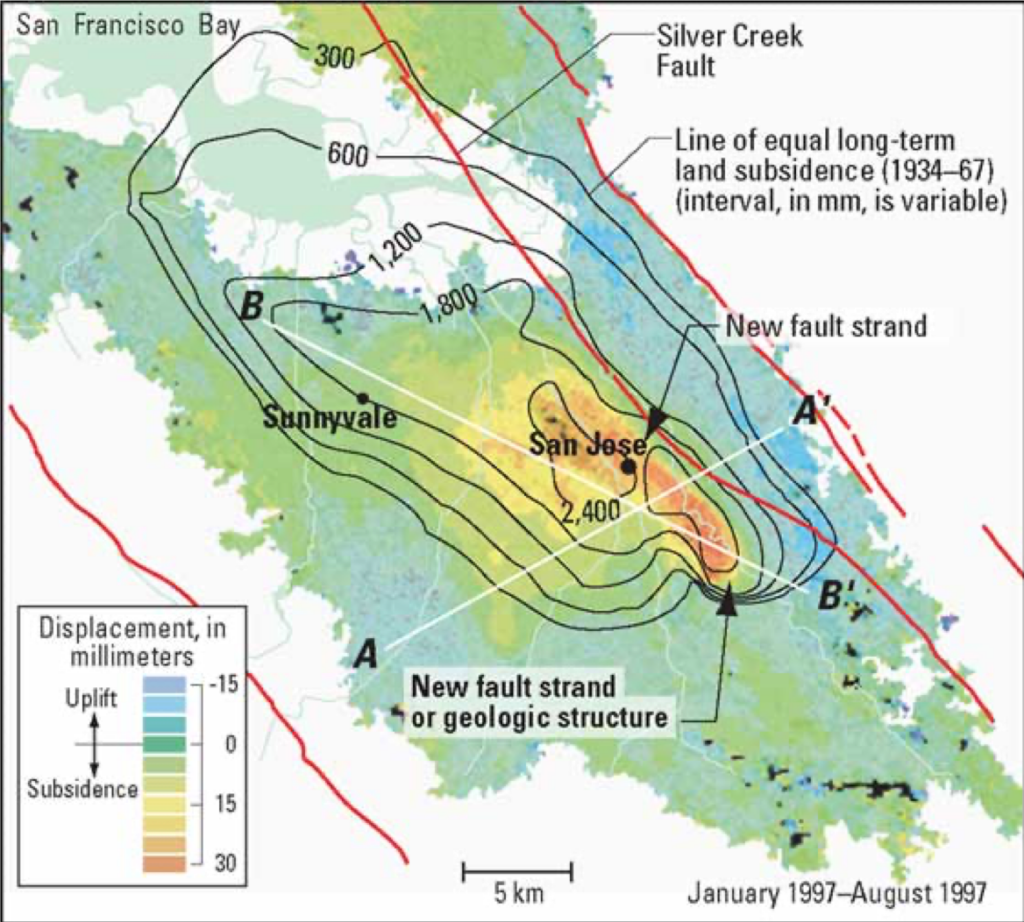
Groundwater usage and aquifer storage are two important processes to study so that the availability of water in regions that get lesser amounts of rainfall is estimated correctly. In areas of thick sediment cover, the addition of rain or surface water that infiltrates the ground can cause the surface to uplift slightly. Then as water is removed from the ground in periods of less rainfall, the ground subsides. This seasonal signal can be tracked with interferograms like the one below, which shows 30 millimeters of subsidence between January and August 1997 in the Santa Clara Valley of California.

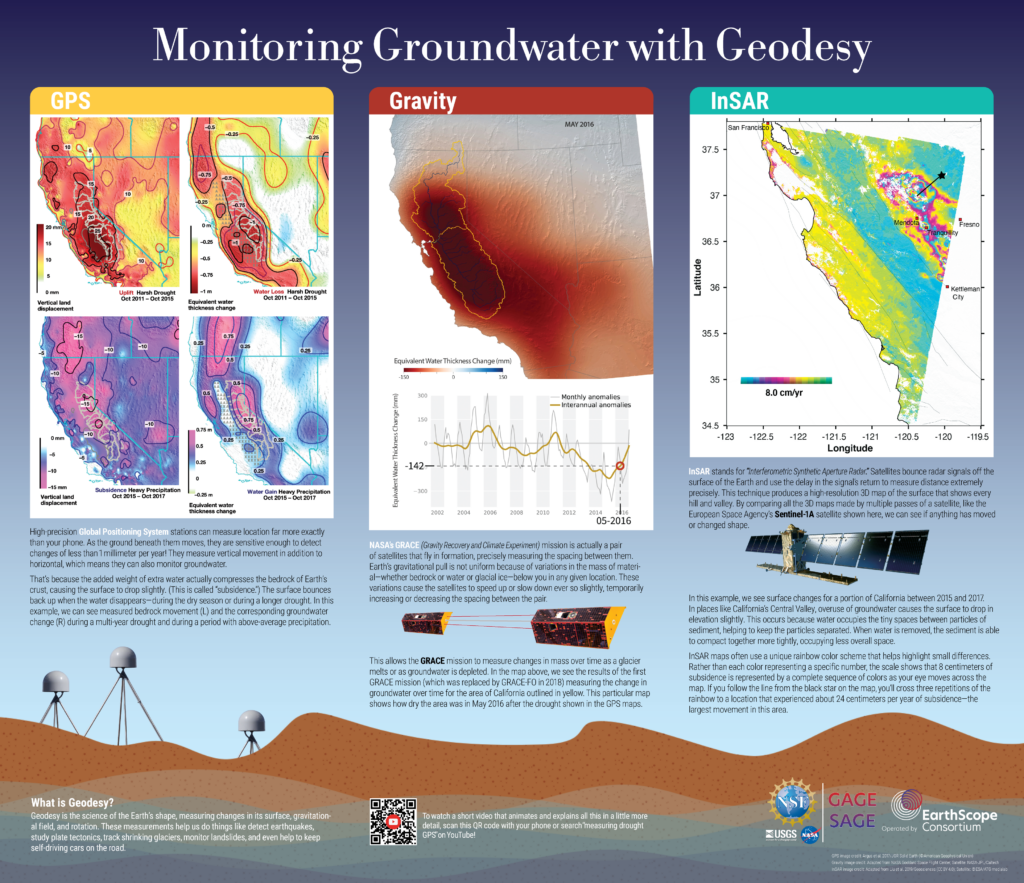
Human activity can also impact aquifers as groundwater is pumped to the surface for purposes such as agriculture and landscaping. If too much groundwater is taken from the ground before the aquifer has a chance to recharge from rainfall, this can cause long-term depletion of the aquifer. InSAR can be used to create time series over decades to view both seasonal signals of water storage as well as long-term trends due to groundwater extraction or drought.

Flood Hazards
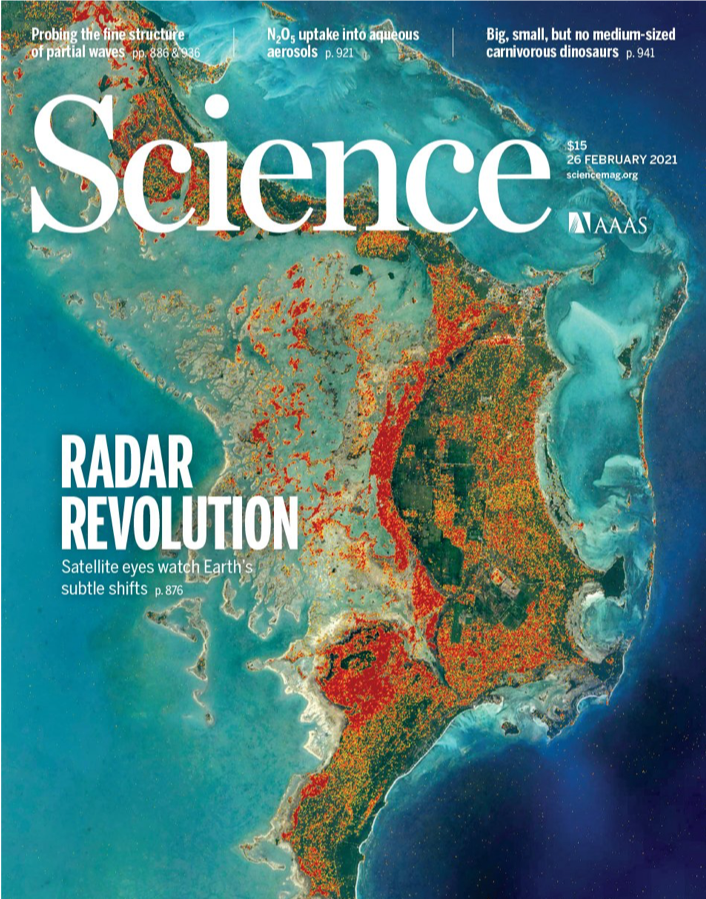
While interferograms that measure elevation change are created by differencing the phase of returning radar waves to satellites from Earth’s surface, the amplitude of the signal can be used to gather additional information. SAR amplitude images provide snapshots of the characteristics of the surface, and those characteristics change when floodwater inundates an area or structures collapse. This can be especially useful for hazard response maps like the image below, which shows areas damaged by flooding in the wake of Hurricane Dorian.


