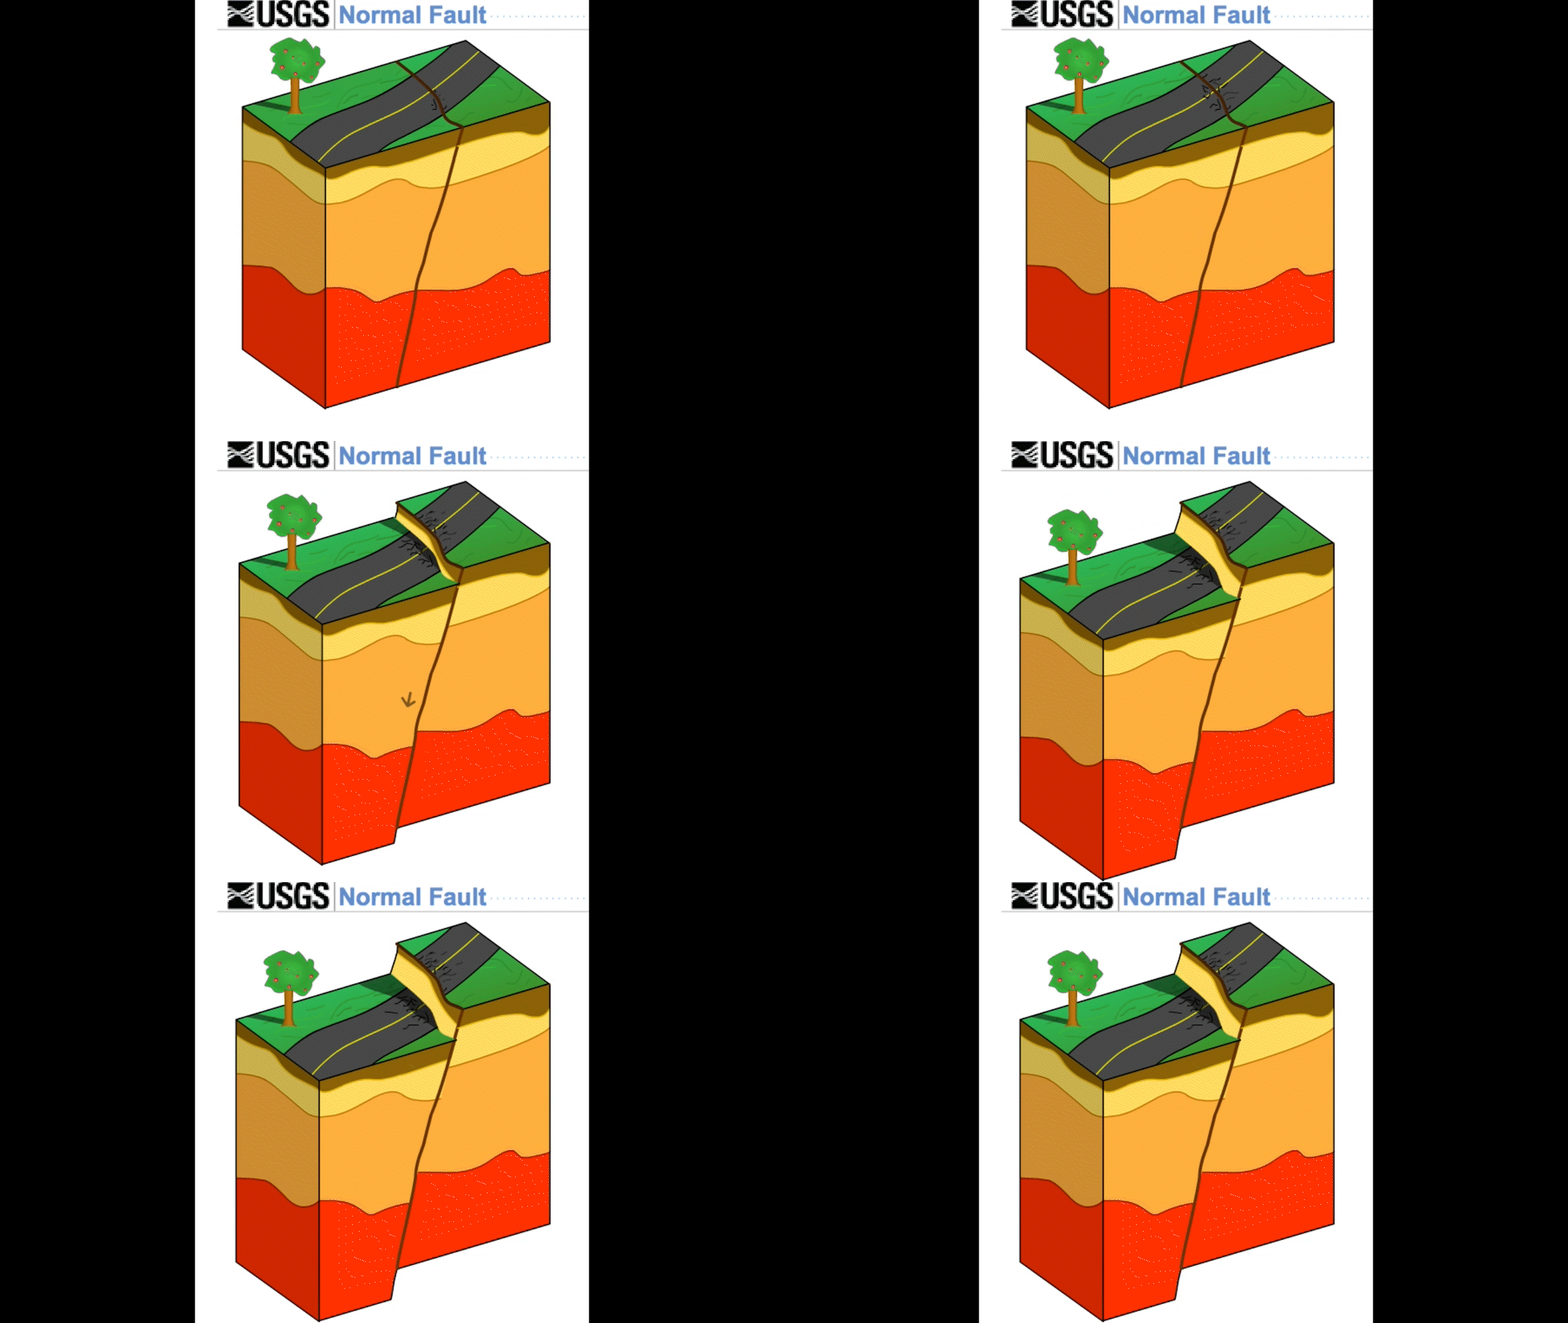
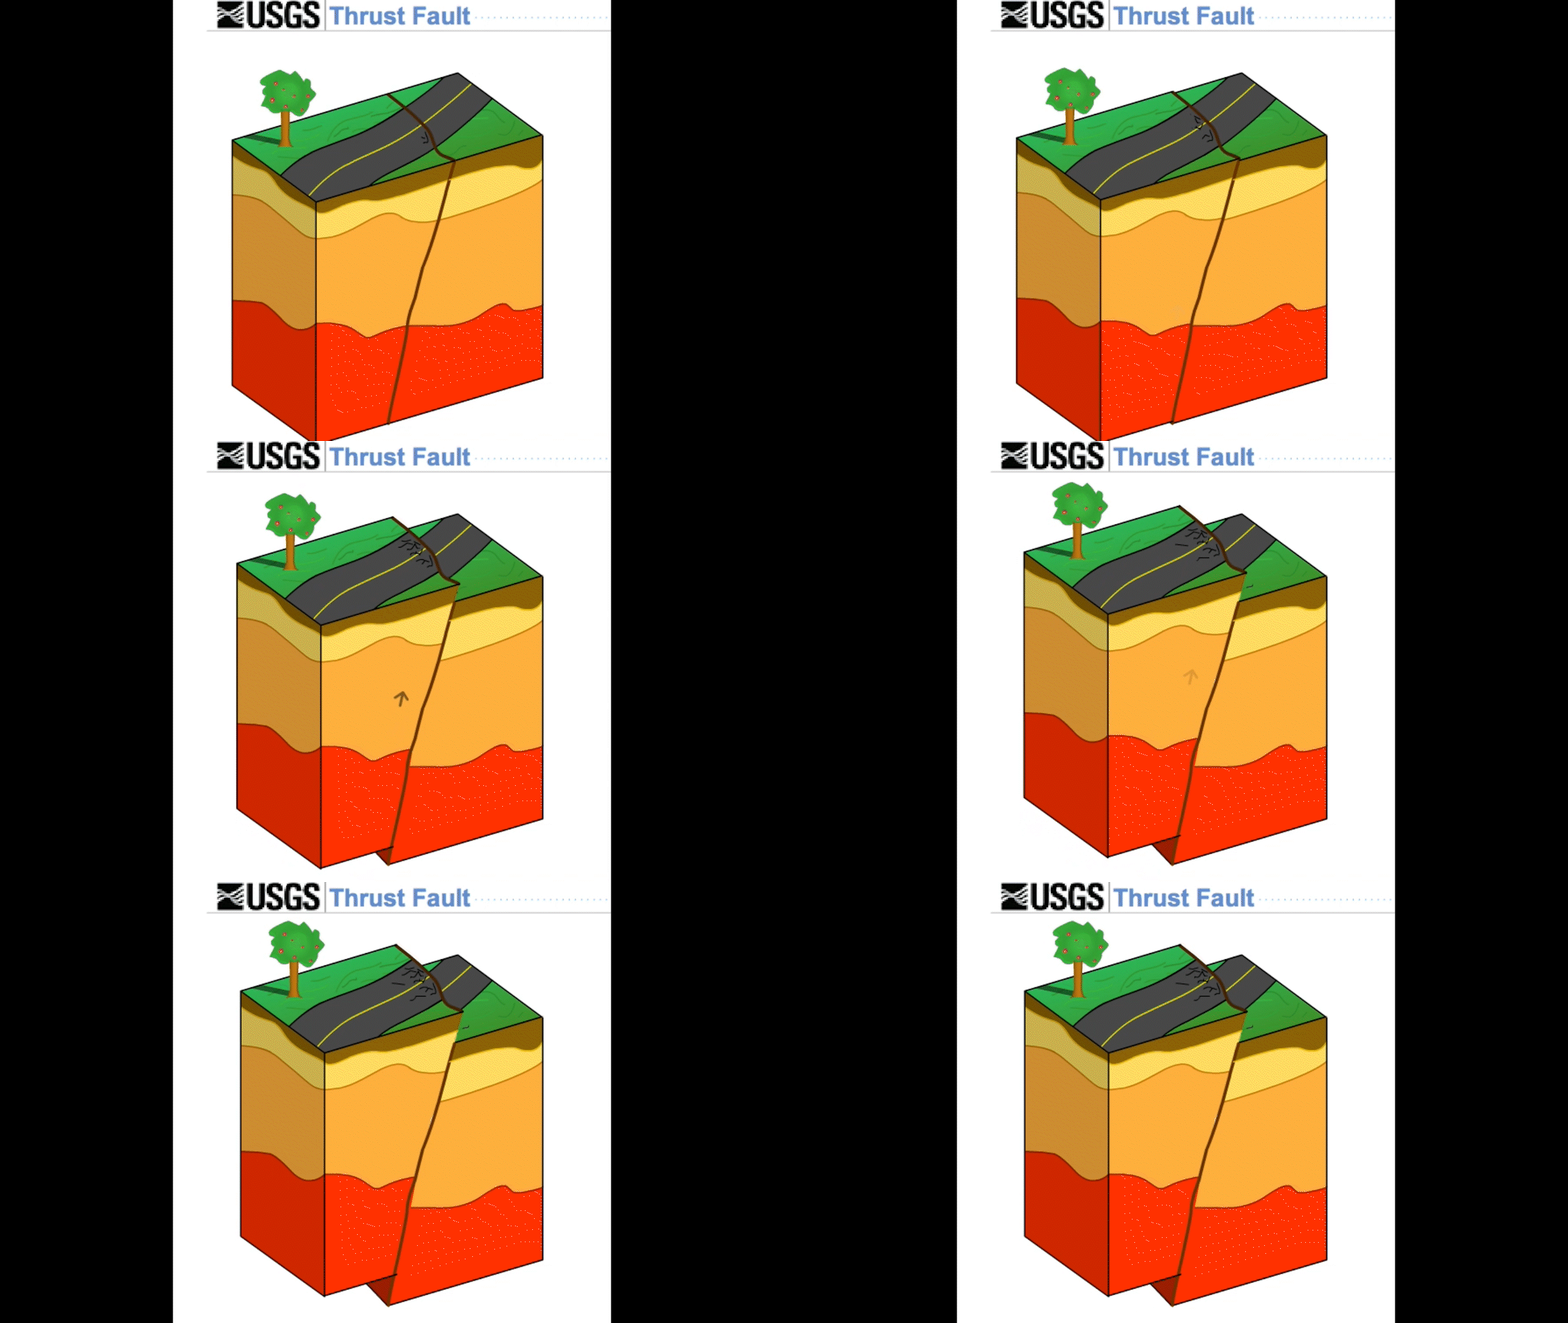
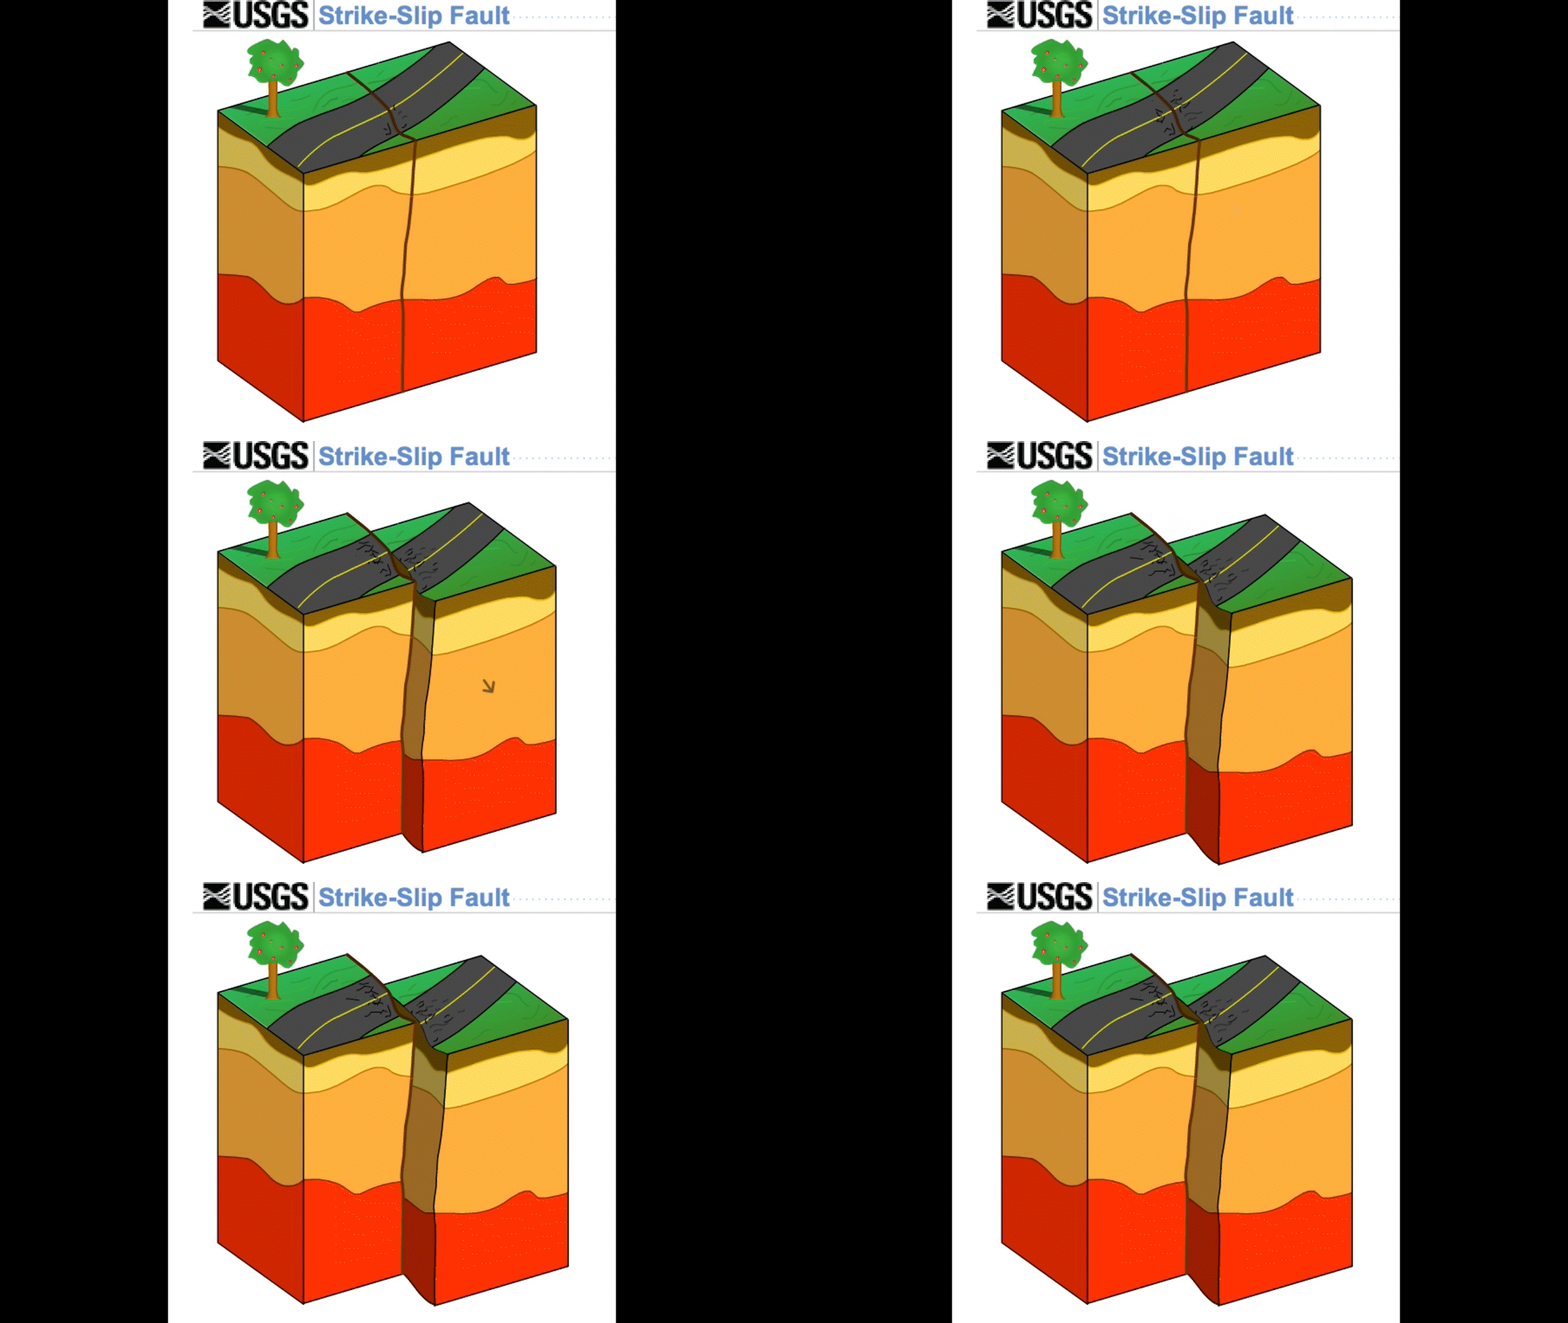
When it comes to natural disasters, geodesy plays an important role in understanding hazards and informing mitigation efforts. While we can’t predict when an earthquake will occur—we can only estimate the probability of an earthquake occurring within a longer timeframe—geodesy allows us to gain a better idea of where future earthquakes will occur and how severe they could be.
An earthquake occurs when a fault quickly “slips,” meaning that the rocks on either side slide past each other. At depths in the Earth’s crust where earthquakes are possible, friction normally keeps a fault locked in place. It’s only when stress builds to the point that it overcomes friction that a fault can move, releasing that accumulated energy as seismic waves. The hypocenter (or focus) is the spot on the fault below the surface where an earthquake begins. The epicenter is the location on Earth’s surface directly above the hypocenter—where you mark the location on a map, in other words.
This process of accumulating and releasing energy is called the seismic cycle. This is not a cycle in the way that the Sun predictably rises and sets—earthquakes do not adhere to a schedule. Instead, the seismic cycle refers to the way earthquakes eventually repeat on a specific section of a fault.
Elastic materials can return to their original shape after being deformed—and this is actually what rocks do at faults. During the inter-seismic phase of the cycle, stress continually builds up as slow elastic deformation occurs. The fault itself isn’t sliding, so the rock on either side must deform to accommodate the continuous tectonic motion. The co-seismic phase is the exact moment that the earthquake actually occurs and the rocks snap back into their original, undeformed shapes as the fault slips. This motion will be the reverse of what we see during the inter-seismic phase. Once the rock fully relaxes and adjusts to this sudden change, the cycle transitions back into the inter-seismic phase of accumulating stress.
Although we often illustrate faults with geometric blocks that make it seem like the entire fault slips during an earthquake, in reality only a portion of the fault moves. If you represent the fault plane with a sheet of paper, you could draw a circle around the portion that slipped, with the rest of the plane remaining locked. The larger the magnitude of an earthquake, the larger this portion is, and the greater the slip movement within it.
For example, the figure below represents the estimated fault slip during the July 28, 2021 magnitude 8.2 earthquake in Alaska. The horizontal axis follows the length of the fault, while the vertical axis follows the plane of the fault down into the Earth. The slip began at the star (the hypocenter) and expanded outward, with the amount of slip gradually decreasing to zero as it propagated away from the hypocenter. The dashed contour lines show the number of seconds it took for the slip area to expand to its final extent.
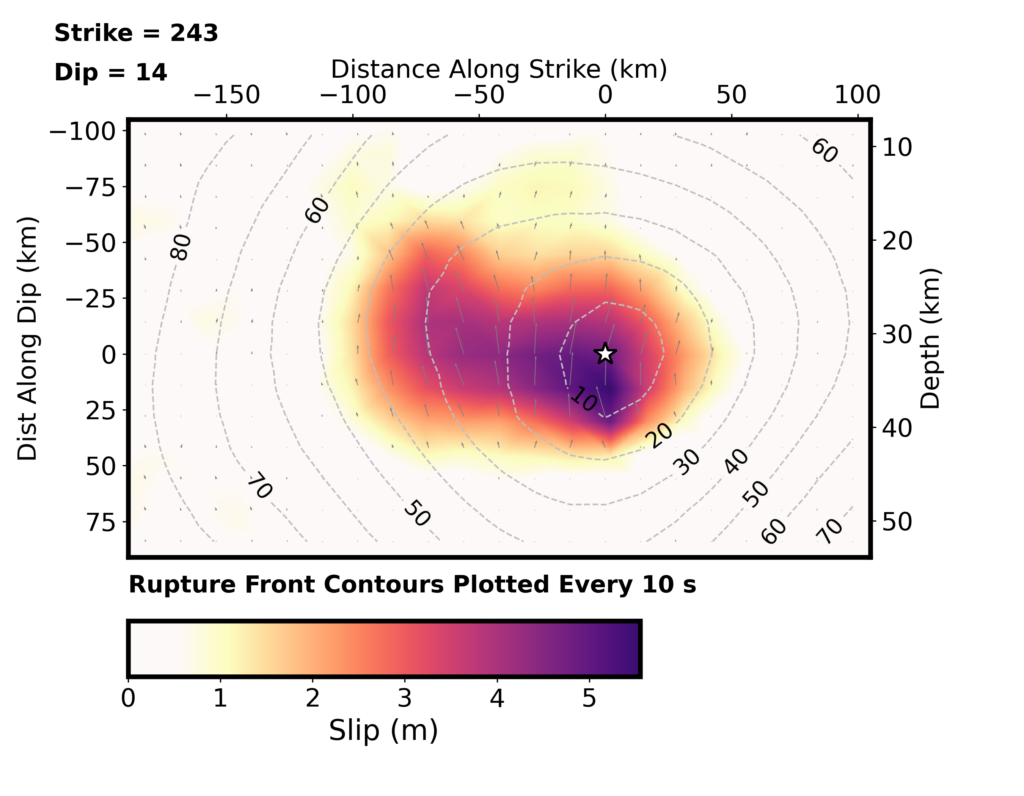
This is important because aftershocks and future earthquakes can occur at the edges of the slip area, as the movement nearby further focuses stress on that spot—like the movement of a zipper pull that stopped halfway down a jacket, partly separating a particular pair of teeth. In order to accurately understand the evolving seismic hazard along a fault, we need to know exactly which portions have slipped in each earthquake.
Geophysical tools like GPS instruments, InSAR data, and seismometers allow us to closely track deformation and fault slip. This helps us understand local seismic hazards so communities can take steps to protect infrastructure and prepare to effectively respond to damaging earthquakes. Additionally, networks of GPS stations and seismometers can power earthquake early warning systems that can alert people before shaking arrives at their location—giving them critical seconds to take protective actions.


