

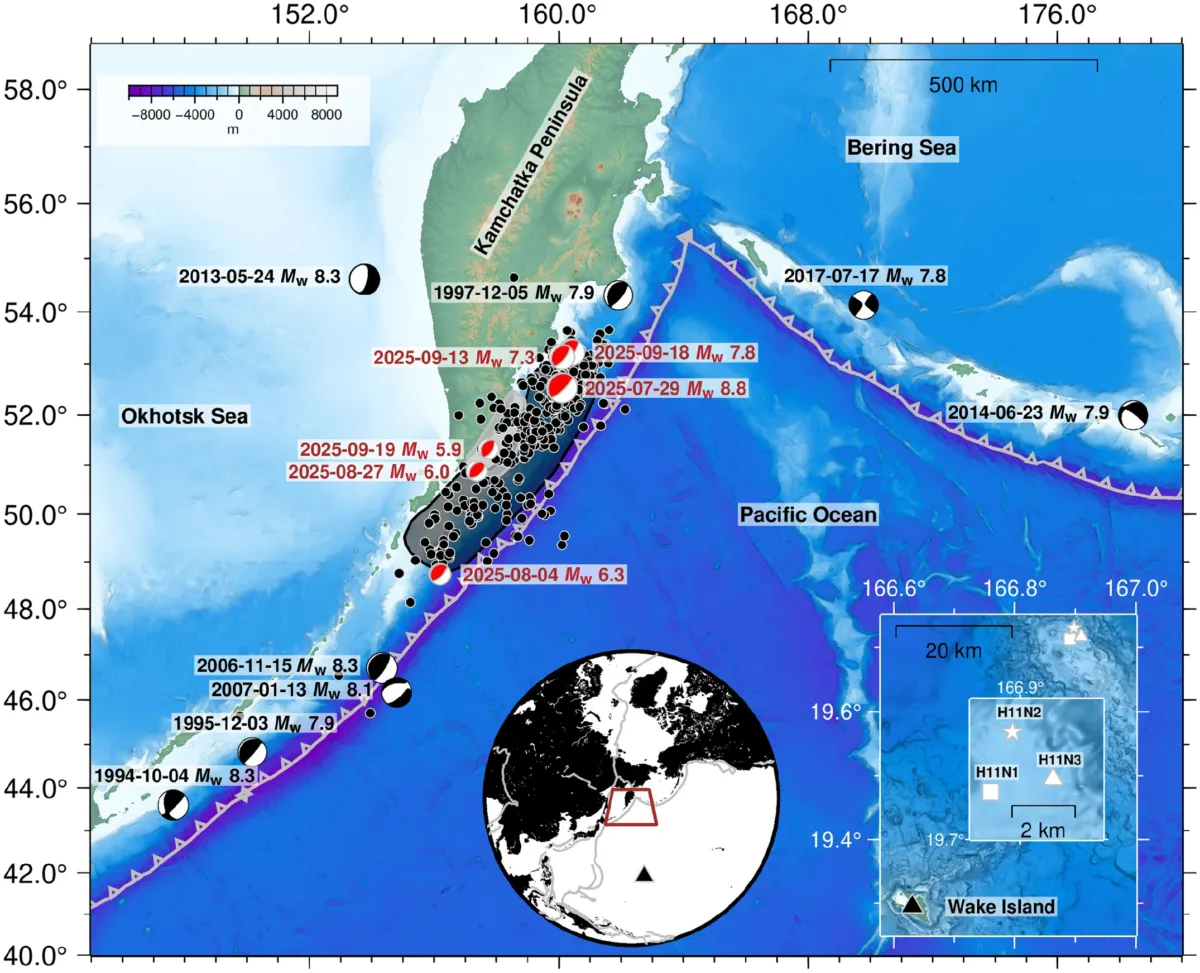
On July 29, 2025, the Pacific Ocean was rocked by a massive magnitude 8.8 earthquake off the coast of Russia. Images and video swiftly appeared of massive tsunami waves pummeling the Kamchatka Peninsula, and tsunami warnings rippled out across the coastlines of the Pacific. While the earthquake ultimately took its podium place as the sixth largest earthquake ever recorded, the Kamchatka Peninsula is no stranger to these violent events. The Peninsula sits on the lip of one of the largest subduction megathrust faults in the Pacific Ring of Fire, part of the Kuril-Kamchatka Trench, making it a prime location for recurring large-magnitude quakes. Even so, large megathrust earthquakes happen sparingly, so it’s hard to gather long-term data on how they actually rupture. When an earthquake does happen, researchers must get crafty to reconstruct the sequence of events. Ultimately, we hope that a better understanding of large megathrust earthquakes will better prepare the millions of people living within tsunami-striking distance.
Filling in the Blanks
In the absence of direct observation, seismologists can use physics to estimate the upper limits of earthquake magnitudes. They use a scaling relationship between the moment magnitude — or measure of energy release — of an earthquake, the fault geometry, and how much the fault surface can slip. As the length, width, or slip amount of a fault increases, so does the magnitude. Thus, shorter, shallower faults are capable of small magnitude quakes while longer, deeper faults can result in much larger magnitudes.
But recent work has suggested that megathrust faults — like the Kamchatka area — can seemingly exceed the rules of this relationship. A powerful example is the devastating 2004 “Boxing Day” Sumatra earthquake, which is now thought to be a magnitude 9.2 – 9.3 and ruptured a record 1200 – 1300 kilometers — 2.5 times the expected rupture length prior to the disaster. This suggests that the tools seismologists have traditionally used to deduce the relationship between fault characteristics and magnitude might be missing crucial information. And, based on data from a June 2026 study published in The Seismic Record, the 2025 Kamchatka earthquake might reveal how this predictive relationship could be improved using a broader array of seismic tools.
Connecting the Dots
To better understand the possible range of magnitudes that subduction zone megathrust earthquakes can generate, seismologists need to know more details about their geometry, coupling depth, and crustal rigidity. Because slip along a subduction zone happens beneath the ocean floor, it’s hard to image these details directly. But that doesn’t mean seismologists are out of options.
Two methods, teleseismic backprojection and hydroacoustic T-waves, can robustly provide researchers with after-the-fact, real-time insight to how a subduction zone rupture evolves.
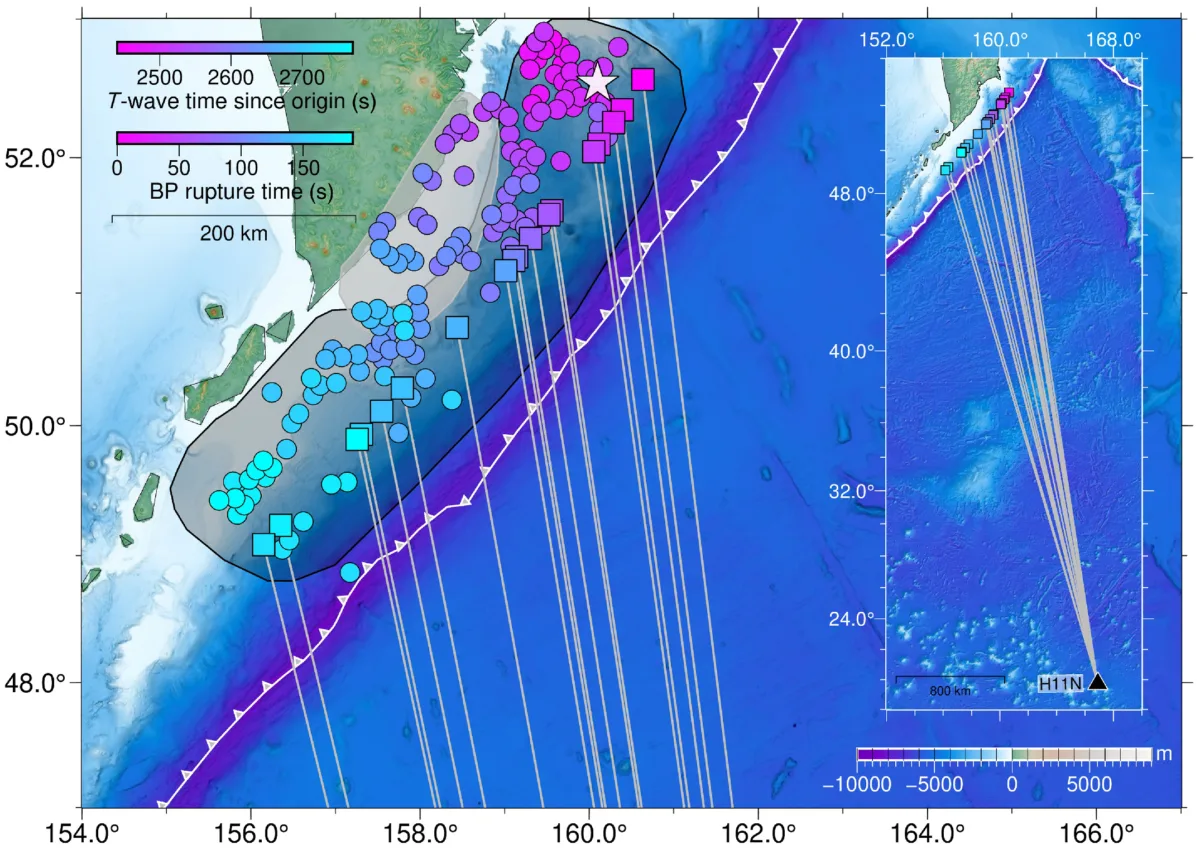
Teleseismic backprojection leverages distant seismic arrays, usually 1000 kilometers or more away, that record the propagation of seismic waves from an earthquake. These arrays can resolve the source and geometry of the rupture zone thanks to their sensitivity to high-frequency waves, which are typically generated by high-energy ruptures like a megathrust. Arrays in Europe, Australia, and the United States were used to reconstruct the Kamchatka megathrust fault rupture with detailed spatial and temporal accuracy. It’s like focusing a camera lens or a telescope on a very distant, tiny light source to resolve the details.
Ears to the Sea
But seismologists can also listen for the whispers of an earthquake, even from far away. When a fault beneath the ocean ruptures, the elastic seismic waves can be transferred to the water as a pressure — or acoustic — wave. These acoustic waves are low frequency, propagating thousands of kilometers through the ocean, effectively allowing seismologists to “hear” an earthquake. Hydroacoustic T-wave recordings are picked up by hydrophone arrays deployed in the ocean, and have been used previously for studies of the 2004 Sumatra earthquake with validation from other seismic and geodetic analyses. For this study, the team used a hydrophone array operated by the Comprehensive Nuclear-Test-Ban Treaty Organization, which relies on the NSF National Geophysical Facility to maintain an open-source data repository. The array is located roughly in the middle of the Pacific Ocean near the atoll Wake Island.
Together, teleseismic backprojection and hydroacoustic T-wave recordings are two methods that can be used to reconstruct a movie of the 2025 Kamchatka earthquake’s genesis, leveraging both high- and low-frequency sensing to understand the rupture length, duration, speed, and direction — and how such observations might deviate from the rupture-scaling relationship.
Redefining a Relationship
The team found that the Kamchatka rupture zone extended almost 500 km southwestward at a staggering speed of almost 3 km/s. The rupturing also appeared to have been phased, with some areas of the fault moving at different speeds, which indicates that mechanical differences along the fault may be an important control on the duration of propagation and energy release.
Importantly, the study’s estimated rupture length of the 2025 quake actually exceeds predictions by traditional rupture-scaling relationships. When using these methods to estimate the rupture length of the Kamchatka quake from its known magnitude (magnitude 8.8), the results come up short, underestimating the length by 50 – 100 km. This strongly suggests that using multiple methods sensitive to different types of seismic signals generated by a megathrust earthquake produces a more robust result. Further, the 2025 earthquake’s rupture length is a good match with the estimated rupture length of the 1952 Kamchatka quake, determined by paleoseismic records. Together, these findings support that a rupture length of ~500 km is realistic for this megathrust zone.
Where to Next?
The Kamchatka Peninsula will see large earthquakes again in the future involving the same megathrust fault, and researchers don’t need to be close by to witness it. Utilizing established seismic networks across the globe uncovers high spatial and temporal detail, revealing how these massive earthquakes happen in real-time. Multiple observation methods, like teleseismic backprojection and hydroacoustic T-waves, get us beyond theory and one step closer to understanding how big these megathrust earthquakes can get.