

When we experience a significant earthquake—along with any foreshocks or aftershocks associated with it—the shaking is hard to ignore. But there are also subtle movements afterward we may only notice with the help of precision instruments. Because the 2019 magnitude 7.1 Ridgecrest earthquake in California occurred near a dense network of instruments that included borehole strainmeters, we were able to capture the slight movements that occurred on several faults in the months following that event.
During an earthquake, patches of fault planes slip and move, releasing accumulated stress as seismic energy. In the postseismic phase, which can span months or years, some amount of gradual movement can continue—even apart from aftershock earthquakes. One way this occurs is called “afterslip”, where some portions of that fault quietly slide a bit more, adjusting to the slip that occurred during the earthquake. Another mechanism is “viscoelastic relaxation”—a sort of putty-like movement of mantle rock in response to the change in the crust above. And there is also “poroelastic rebound”, where fluid pressure in the crust caused by the original fault movement slowly bleeds off.
Unfortunately, these processes are usually difficult to tease apart without the right data. But fortunately, the Ridgecrest earthquake occurred in an area where we could capture the right data.
Strain to see
In a recent paper published in JGR Solid Earth, a team led by Catherine Hanagan at the USGS (an alum of our Career Internship Program) used the 3 borehole strainmeters and 16 GNSS instruments nearby—part of the Network of the Americas operated by the NSF GAGE Facility—to map out the postseismic movement. Borehole strainmeters are incredibly sensitive, measuring deformation of the bedrock as small as one part in one billion. This yields unique observations that both seismometers and GNSS instruments would miss.
The team used a model to back out fault movements based on all the available data. That starts with the earthquake sequence itself—the magnitude 6.4 foreshock on July 4 and the magnitude 7.1 main event the next day on a second intersecting fault. The model results for which patches of which faults ruptured during the sequence look similar to previous results based on all the available data, including seismometers and InSAR. During the magnitude 7.1 earthquake, the main fault slips up to 6.6 meters, with the largest slip a couple kilometers deep at the epicenter.
That leads into the postseismic model, which extends through the end of 2019. As is typical, a good deal of that motion occurs in the first few days, with activity slowing down quickly. But for the fault that moved the most, this added up to 1.5 meters of slip by the end of the year. If all the “afterslip” in the model occurred at once as an earthquake instead of spread over months, it would equate to a magnitude 6.5.
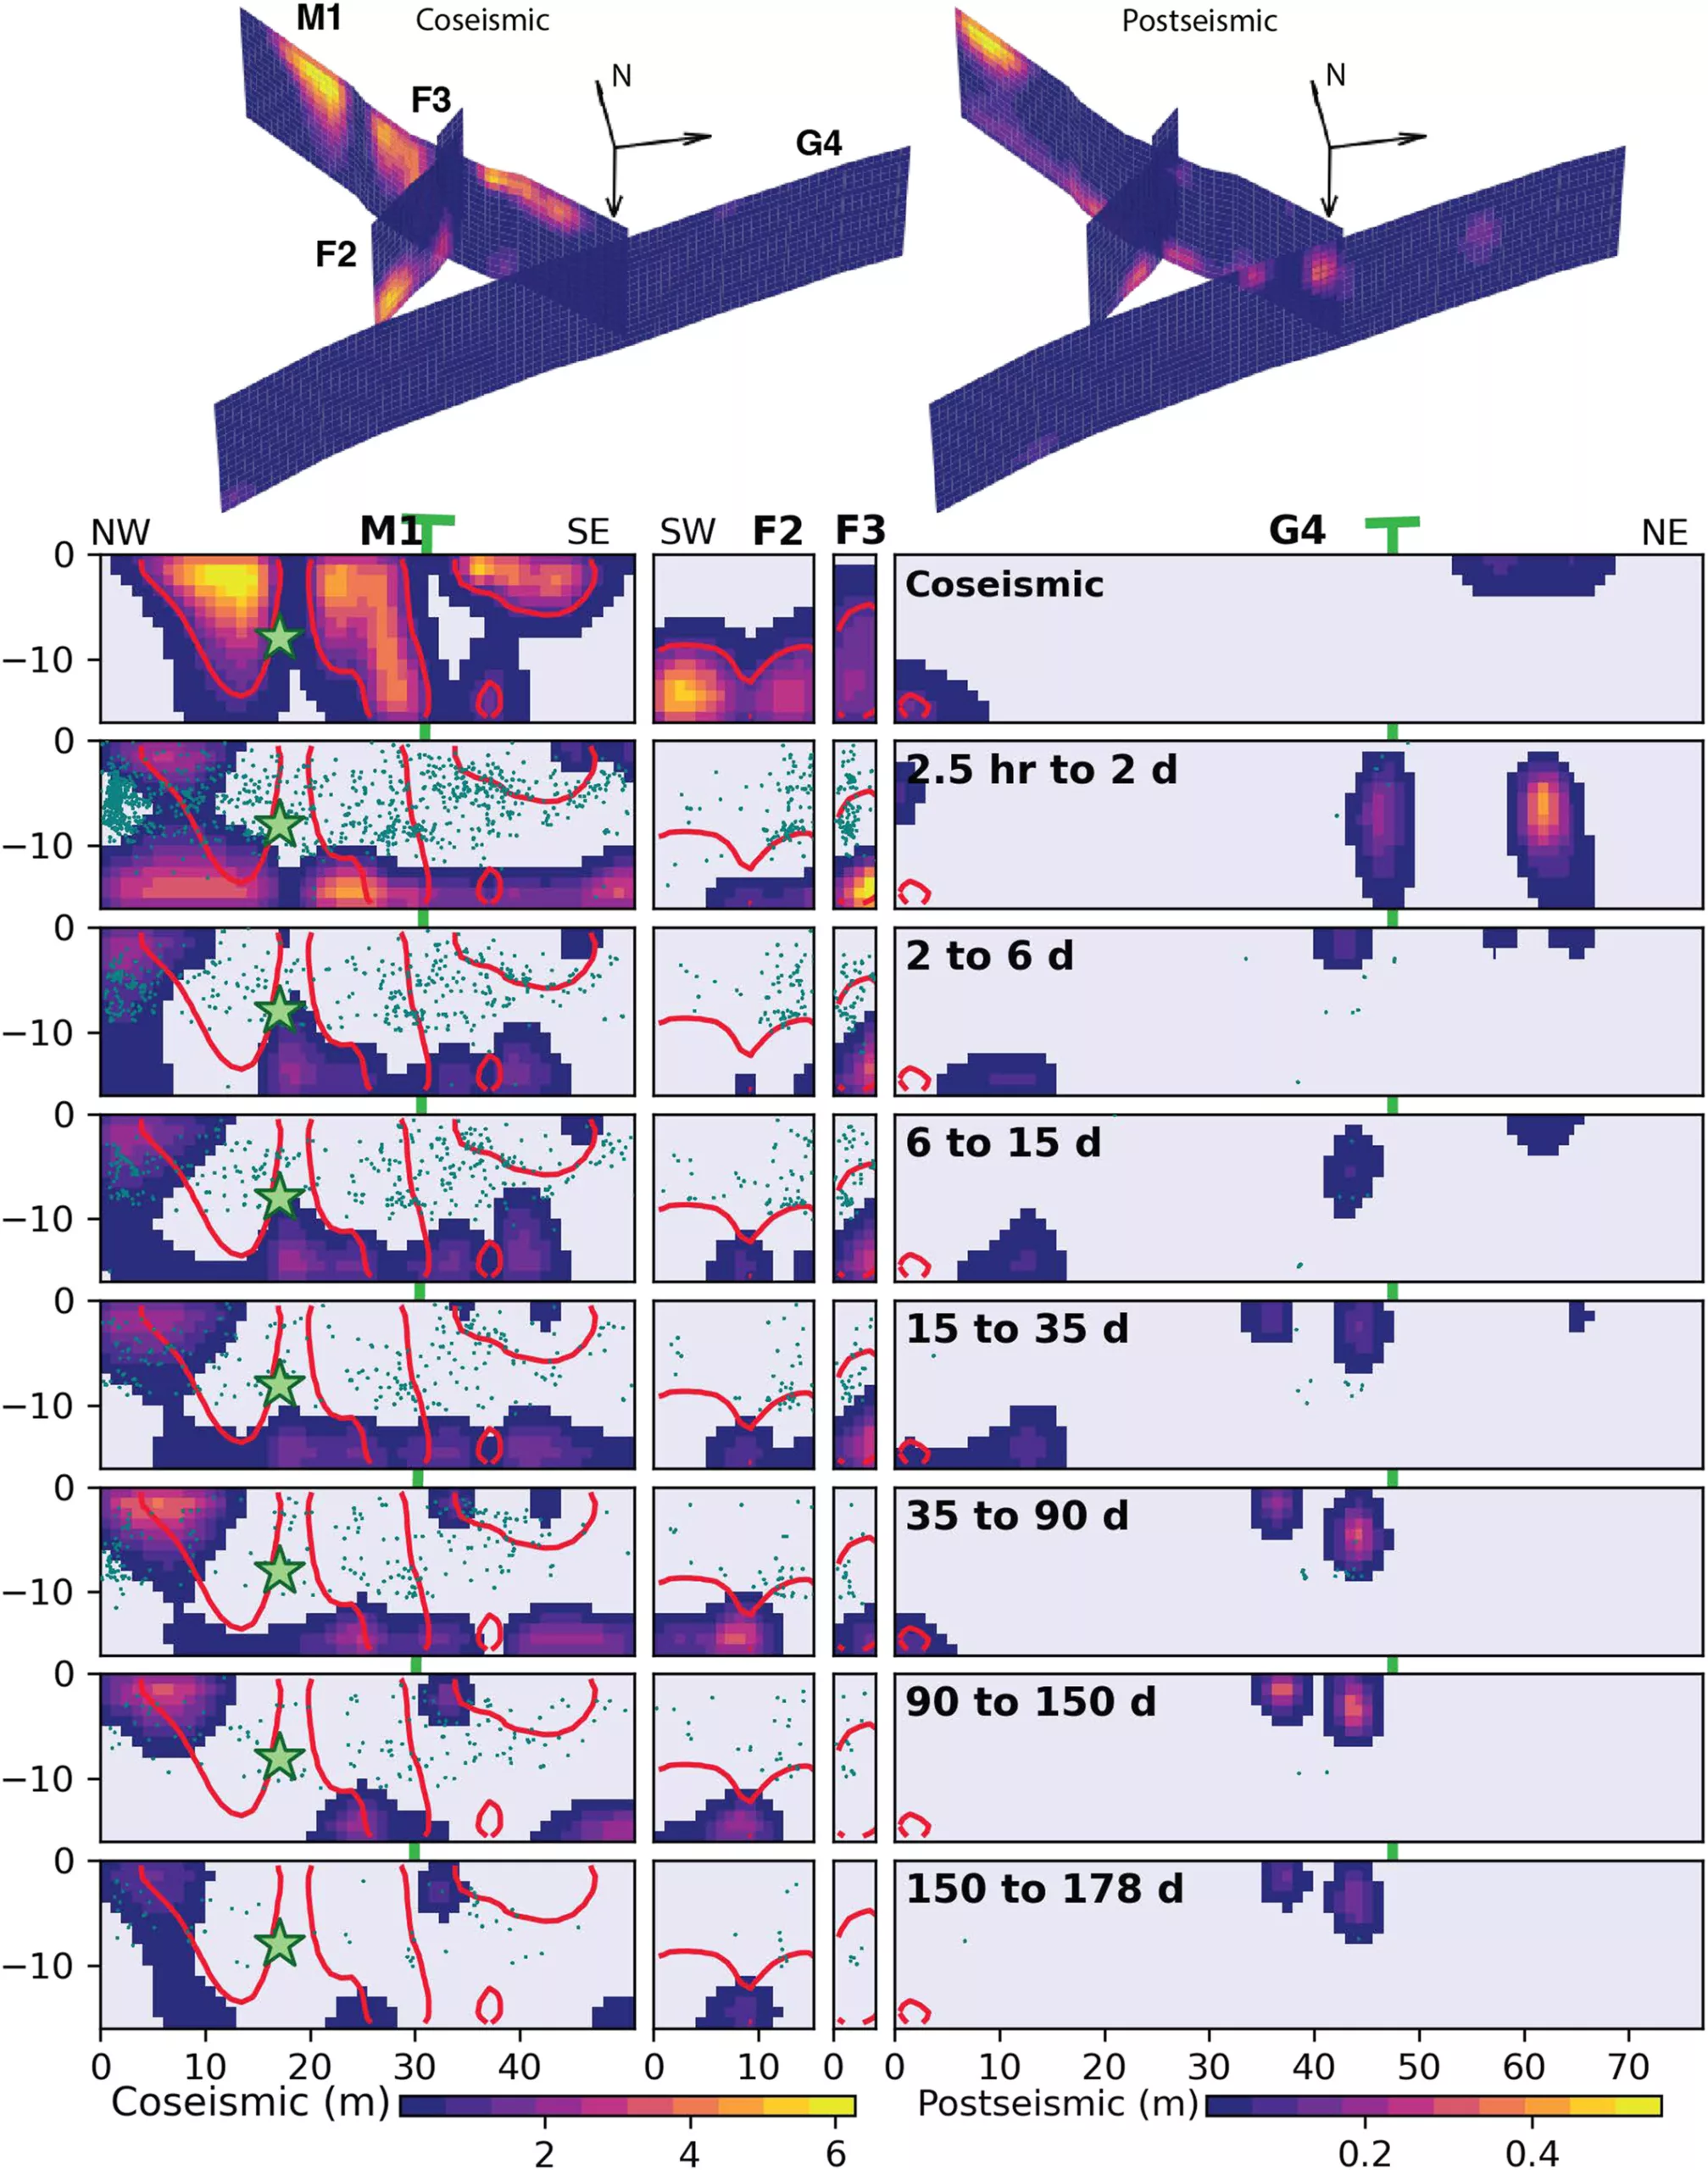
On the fault that saw the main earthquake, the afterslip starts from the edges of the area that ruptured during that earthquake, expanding it to the northwest, southeast, and to deeper depths along the plane of the fault. The intersecting fault that hosted the foreshock earthquake also gets moving before long, with afterslip occurring deeper and focusing on a patch that had moved the least during the earthquake.
A third intersecting fault that showed interesting behavior during all this is the Garlock Fault, which crosses almost perpendicular to the main fault. While no larger earthquakes occurred here, visible movement of the fault was seen at the ground surface. The model assigns afterslip to that area, near where the faults intersect, as well as a couple other distinct patches.
What comes after the afterslip?
As far as the pattern of this activity in time, the main fault and foreshock fault generally follow the expected mathematical relationship―starting out faster and slowing down rapidly. The Garlock fault behavior is more complex, though. Still, the research team says all these things look like afterslip resolving the stress of the main earthquakes, with varying physical properties along each fault complicating where and when things occur. Additional processes like viscoelastic relaxation and poroelastic rebound aren’t needed to explain the data.
Collecting data from multiple types of geophysical instruments provides a more complete picture, particularly in more complex situations like this. With this information, we can better understand what shifted before, during, and after an earthquake. That’s critical to helping us figure out where the seismic hazard may have increased. The Garlock Fault, for example, seems to warrant a closer look. The more we know about where it has moved and where it hasn’t, the more we can say about how it may behave in the future.