Projecting future sea level rise is no easy task. There are a host of reasons for that, one of which is the human element—it depends on future greenhouse gas emissions. But the physical system is complex enough on its own. Each glacier is its own puzzle to solve based on its unique surroundings.
One of the hardest characteristics to define is not just hidden beneath the ice, but deep below the Earth’s surface. Glaciers actually affect land elevation—the burden of a thick ice sheet depresses the land surface, and relieving that burden by melting ice causes the land to rebound upwards—and the size of this effect depends on the properties of the crust and mantle in that area.
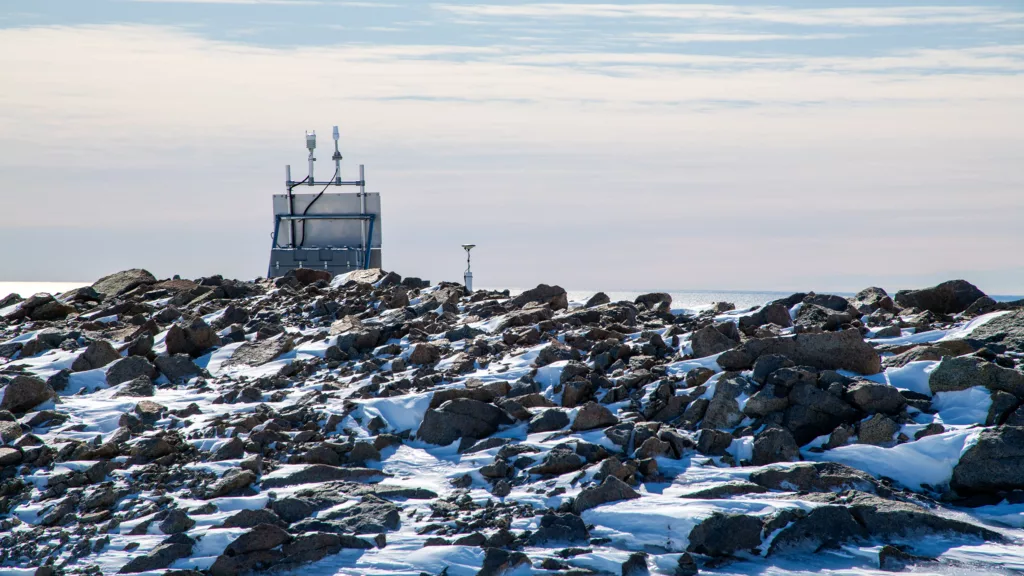
GPS/GNSS instruments and seismometers can help us reveal those properties. GPS instruments on exposed land measure the ongoing rebound movement of the bedrock. And seismic data allow us to image deep structure, like the thickness of the crust or areas of warmer and cooler mantle. A new study in Science Advances led by McGill University’s Natalya Gomez uses the latest maps of the structure beneath Antarctica along with the latest ice sheet models to see how important realistic crust and mantle information is to sea level rise. The answer? It’s pretty important.
Simulating a changing Antarctic
Accounting for this upward rebound—known as “glacial isostatic adjustment”—isn’t a new idea. But more detailed attempts can better estimate the effects on specific portions of the ice sheet, and the effects within shorter timescales more relevant to the near future.
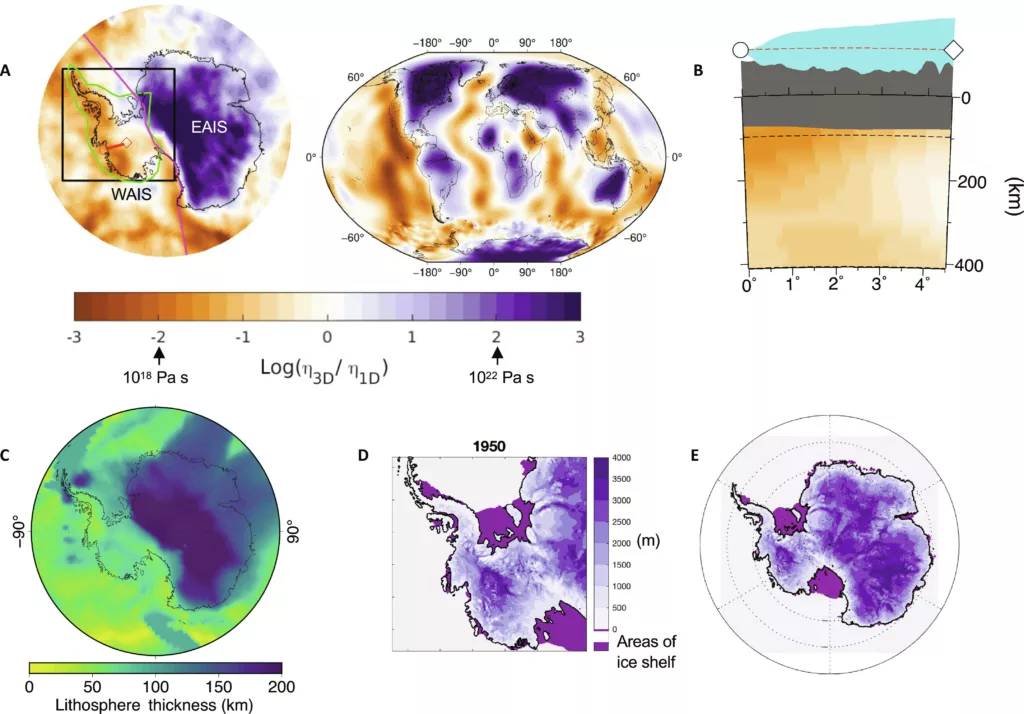
Rather than using a simplified version of the structure beneath Antarctica, this study adds the most detailed map we currently have. This is based on data including the POLENET GPS and seismic stations long supported by the NSF GAGE and SAGE Facilities operated by EarthScope.
Beneath the West Antarctic Ice Sheet—the most vulnerable part of the ice sheet—the crust is relatively thin and the upper mantle is warmer and less viscous, making for rapid upward rebound. That’s particularly true along the Bellingshausen and Amundsen seas, and less extreme near the Transantarctic Mountains. Beneath the East Antarctic Ice Sheet, on the other hand, the crust is much thicker, with cooler, more viscous mantle beneath. All this means that glacial isostatic adjustment is going to vary considerably from one area to another.

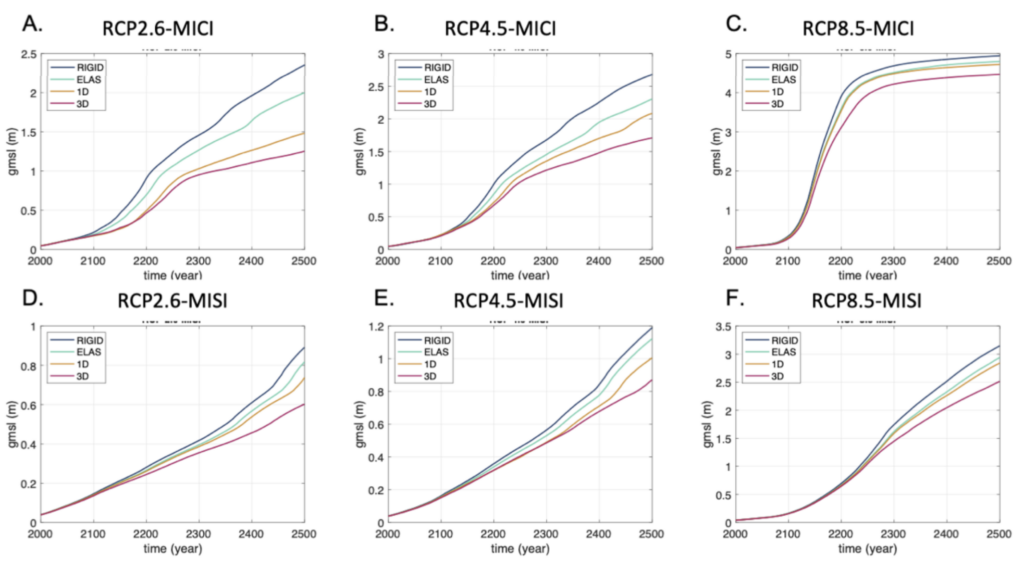
The research team simulated Antarctic ice out to the year 2500 in a number of configurations. One test was to repeat the simulations with several simpler representations of the solid Earth to see exactly how the new more detailed map affects the results. There were also three scenarios with low, medium, and high greenhouse gas emissions. And for one more factor, all simulations were run with and without a poorly understood but critical pair of physical glacial processes—fracturing of ice shelves under the fluid pressure of melt ponds and the collapse of ice cliffs at a glacier’s calving front when they exceed a height threshold. These two ice instability processes have greatly increased future ice loss when added to model simulations, but it’s unclear exactly how realistic this is.
For better and for worse
The results showed that the effect of including more detailed solid Earth structure was significant, but in different ways between the low and high emissions scenarios. With low emissions—a world where global warming is limited to about 2°C—the finer solid Earth structure detail reduced the total ice loss. This is because the upward rebound beneath the West Antarctic Ice Sheet was quicker and stronger. This lifts glaciers that are retreating into areas where the land surface is currently below sea level, where they partially float and become unstable.
But in the high emissions scenario—a world that warms more than 4°C—the models yielded the opposite result. Here, glaciers of the West Antarctic Ice Sheet retreated too quickly for upward rebound of the land to have any influence. Instead, the strong rebound acted simply to push seawater off of inundated land already barren of ice.
Looking at the low emissions scenario, the solid Earth starts making a difference around the year 2100. By the year 2500, the more detailed solid Earth structure produces 0.7 meters of global sea level rise from the West Antarctic Ice Sheet, while simpler representations of the solid Earth (including simply holding bedrock elevations constant) produce 0.82 – 0.89 meters.
Once you add in the extra ice instability processes, which more than doubles the total ice loss, the difference is even larger. The best solid Earth model produces 1.68 meters, while the constant bedrock simulation is much higher at 2.35 meters.
In the high emissions simulations, that relationship then flips to 5.75 meters of sea level rise for the best solid Earth model and 4.94 meters for constant bedrock. That difference shows how much water the rebounding bedrock displaces after the ice is gone.

The point here is not that one particular version of this model is now the best future sea level rise projection, the team says. It’s that the solid Earth makes a pretty big difference that has to be accounted for. And that means that if we could get an even more detailed map of the solid Earth beneath Antarctica, we’d be able to improve model projections further.
“We have found that the effect of [glacial isostatic adjustment] is to reduce the Antarctic contribution to global sea-level rise for low emissions and amplify it for high emissions,” the team writes. “Therefore, reducing greenhouse gas emissions will allow the rebound of the solid Earth to play a greater role in preserving more of the [Antarctic Ice Sheet] and avoiding the worst and most inequitable impacts of future climate change on global coastlines.”

