

How many people know that the famous Mammoth Mountain in California—a global destination for snow sports in the winter and hiking in the summer—is actually the location of an active volcano? Mammoth Mountain is one of the many lava domes that dot the eastern Sierra Nevadas adjacent to Long Valley Caldera. Its last major eruption was about 57,000 years ago, but seismic activity is still detected in the area. Those famous hot springs that tourists flock to year-round are really fueled by the still-liquid magma chamber that fans out underneath the surface of the valley. Every once in a while, the magma moves around a little, causing nearly imperceptible tremors or releasing of toxic gas.
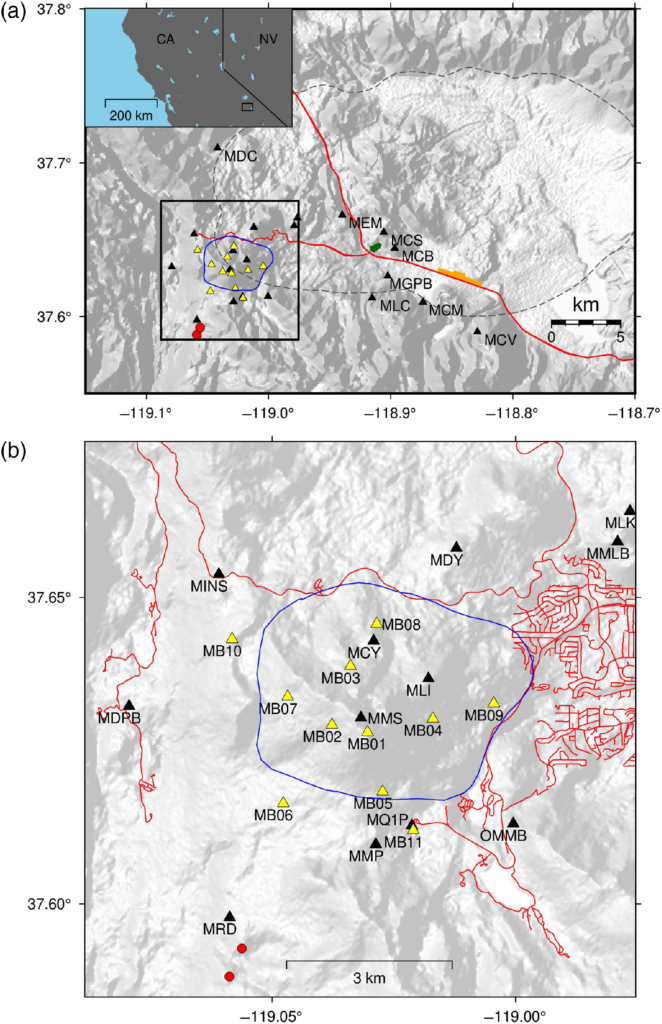
Given that Mammoth Mountain is still active, it is important to study its signs of life so that researchers and planners can best prepare for future volcanic hazards, whether those be outgassing of toxic fumes or earthquakes. Researchers in a new paper utilized a seismic array around Mammoth to test out a new automated detection workflow to see if they could reliably identify the precursors to these hazards.
Other researchers are developing similar volcano-seismic detection systems that rely on machine learning algorithms to identify patterns. However, to reliably implement these workflows, the algorithms need access to large datasets, which may not be available in all areas for all types of seismic signals. Moreover, machine learning algorithms are typically only trained on one set of data from a single type of volcano. This means it can’t be applied to other volcanic systems with different eruptive styles and characteristics.
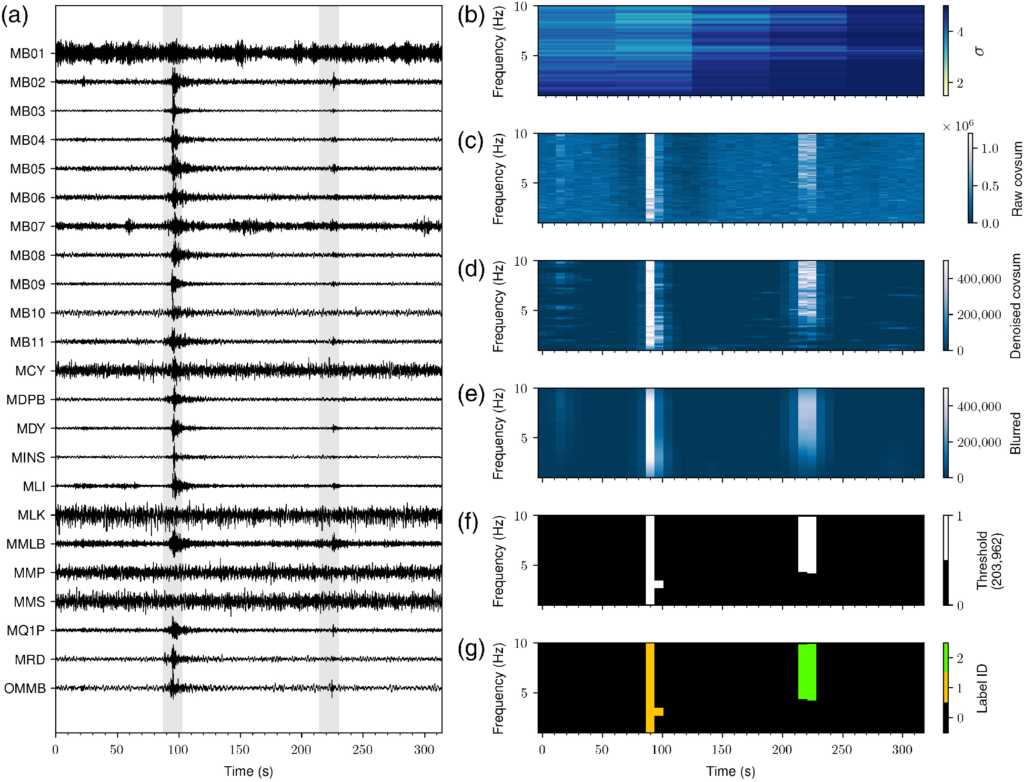
In the case of Mammoth Mountain, techniques from image processing are used in order to identify seismic signals from around the region. The team used a recently developed framework called the network covariance matrix to look how the frequency and amplitude of seismic signals at different times and locations were related. This methodology, when applied to seismology, can help researchers understand the similarity of seismic signals across time, and also help them start to identify where those signals are coming from. While there are no “images” taken in this study, image processing techniques can be used to understand aspects of the seismic signal frequencies. This is done by transforming the original seismic signals into spectrograms, which helps you to visualize the frequencies associated with the signal. Image processing allows you to pull out other features besides frequency, like amplitude or variability, in time that can be used to characterize different types of seismic activity.
Here’s how it works: ideally, researchers are looking to detect a real seismic signal, and one way to do this is to look to see how consistent an abruptly generated signal is across an array of stations. When a network perspective is applied, network covariance identifies the most dominant signals detected across the entire array of stations. Instead of relying on isolated measurements at individual stations, the network covariance method improves the ability for the array to detect real and consistent signals. This can be more accurate overall and can more readily distinguish real events from seismic noise or signals that don’t represent geophysical processes (like human activities).
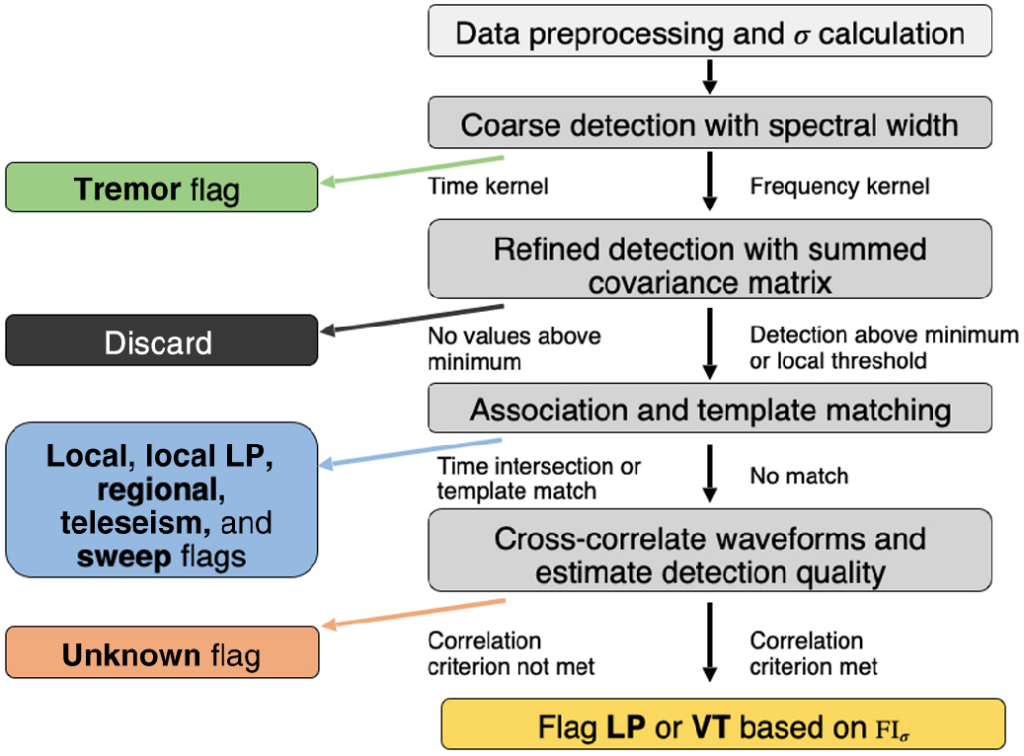
In the case of the Mammoth Mountain data, the researchers were interested in detecting and distinguishing between two types of signals. Long period and volcanotectonic seismic signals have distinct frequencies and amplitudes. This is because they are representing different processes. Long-period signals might be indicative of magmatic fluid processes fracturing rock, while volcanotectonic signals can tell researchers about how magmatic fluid migrates through cracks and conduits.
Quizzically, the status quo method for identifying long period signals relies on manual identification—a seismic analyst will inspect records from seismometer stations and categorize a signal as volcano-related or not. While some level of human oversight is useful for making sure a reasonable identification scheme is employed, this is tedious and subjective work that fully relies on consistent resources being allocated to complete the job. Seismic detection centers, therefore, could benefit from an automated system that can categorize signals from a large pool of data.
After applying the network covariance matrix to a slew of seismic data from Mammoth Mountain collected between July 2012 and October 2013, the team was able to assess how well their new workflow performed. Because this was historical data, the results of the automation could be compared to cataloged events as a way to both check for accuracy but also identify limitations of the previous workflow.
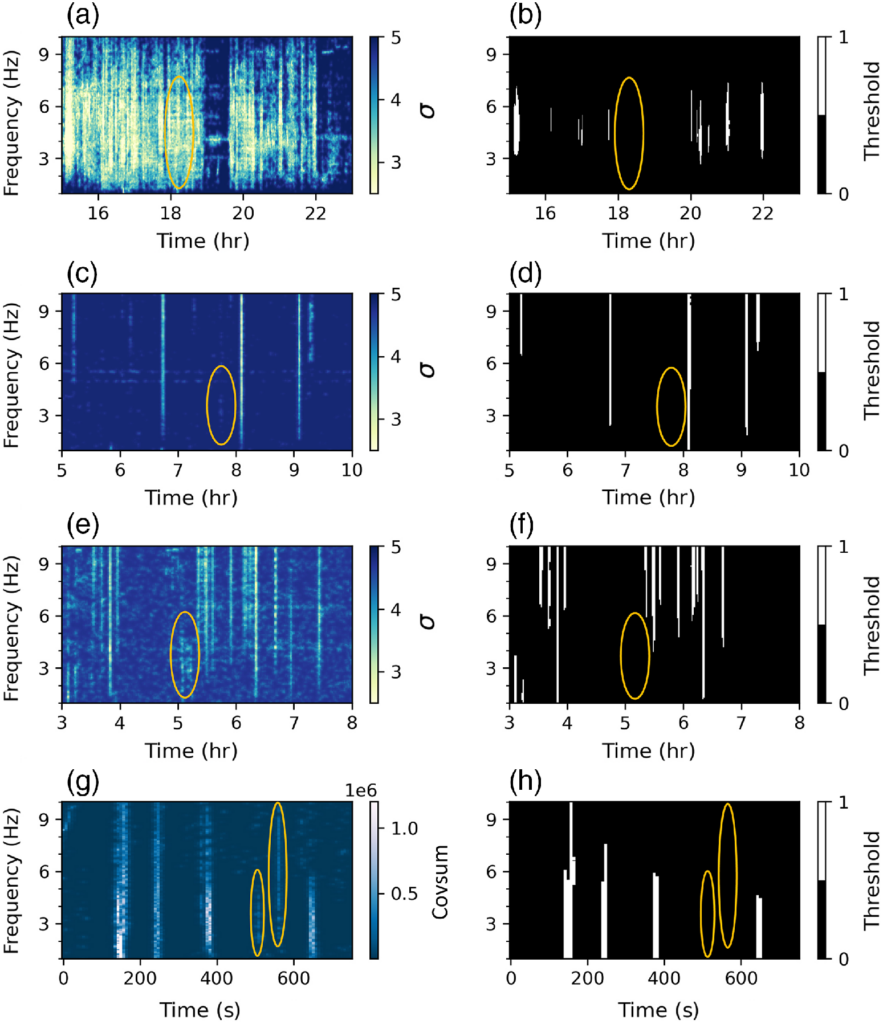
The results are both encouraging but require improvement. Using the catalog of previously detected events, the researchers found that 62% of long period events and 96% of volcanotectonic events were detected using the network covariance method, and they even identified previously undetected events. However, some known events were not detected at all, which could be due to other sources of noise, like the bustle of chair lifts and nearby traffic, overprinting the signal. This throws a little bit of doubt on the newly-detected events because there are no other records of seismic events to compare to, and the risk of other non-geophysical processes obscuring real occurrences mean that these new events can’t be used as definitive evidence. Moreover, network covariance suffers from the inability to identify short-lived events.
Overall, this is a step in the right direction to automating the process of detecting seismic signals related to potential hazards, despite the limitations. Fine-tuning the workflow, including adjusting the sensitivity to signals, will help make network covariance a more viable alternative to current single-station techniques.