

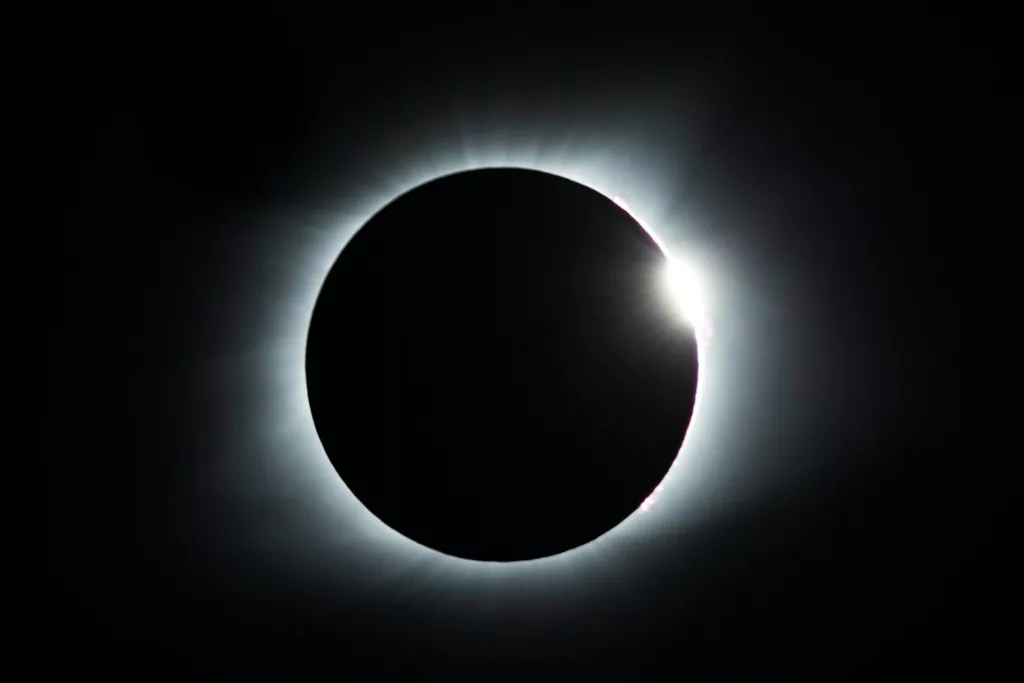
Many people traveled to observe the April 8, 2024 solar eclipse passing over the United States, looking for a unique experience within the path of totality. Similarly, many scientists carefully prepared to record various kinds of data, because there is unique scientific value in these short-lived events.
For example, solar eclipses provide an excellent opportunity to study the upper atmosphere and ionosphere—a region of charged particles that impacts communications signals. The passing shadow of the eclipse creates a natural experiment, suddenly reducing solar energy to an isolated area. The ionosphere and atmosphere respond to this in interesting ways, giving researchers insight into difficult-to-study processes.
Every eclipse is a valuable opportunity. Because the exact path, timing, and local conditions are different each time (take the 2021 eclipse over Antarctica, for example), each eclipse can reveal new information. And as time goes on, the data we can collect may improve in precision, coverage, or processing technique, showing us more than we could see in past eclipses.
In August 2017, a total solar eclipse passed from northwest to southeast over the United States. A team of researchers led by scientists at MIT Haystack Observatory worked with Total Electron Content data, which track ionospheric conditions, to examine the eclipse response.
This Total Electron Content dataset is produced using geodetic GPS instruments. Because the ionosphere delays the signal from navigation satellites, significant effort goes into measuring this delay to make position measurements more accurate. Since the delay correlates with Total Electron Content, GPS instruments on the ground can serve double duty as ionosphere-monitoring devices.
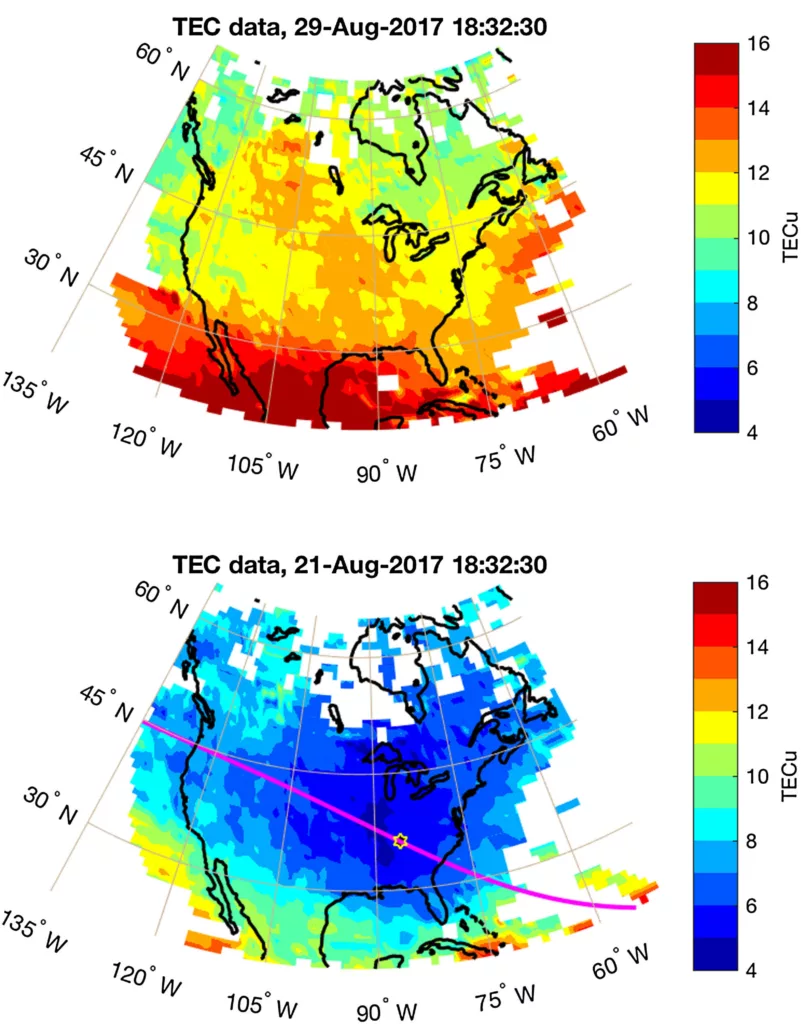
The data recorded the significantly decreased Total Electron Content caused by the reduction of solar energy that continuously produces charged particles. One interesting detail was a resilient area over the Rocky Mountains that didn’t decrease as much—believed to be caused by air pressure patterns interacting with the mountains and affecting the ionosphere above.
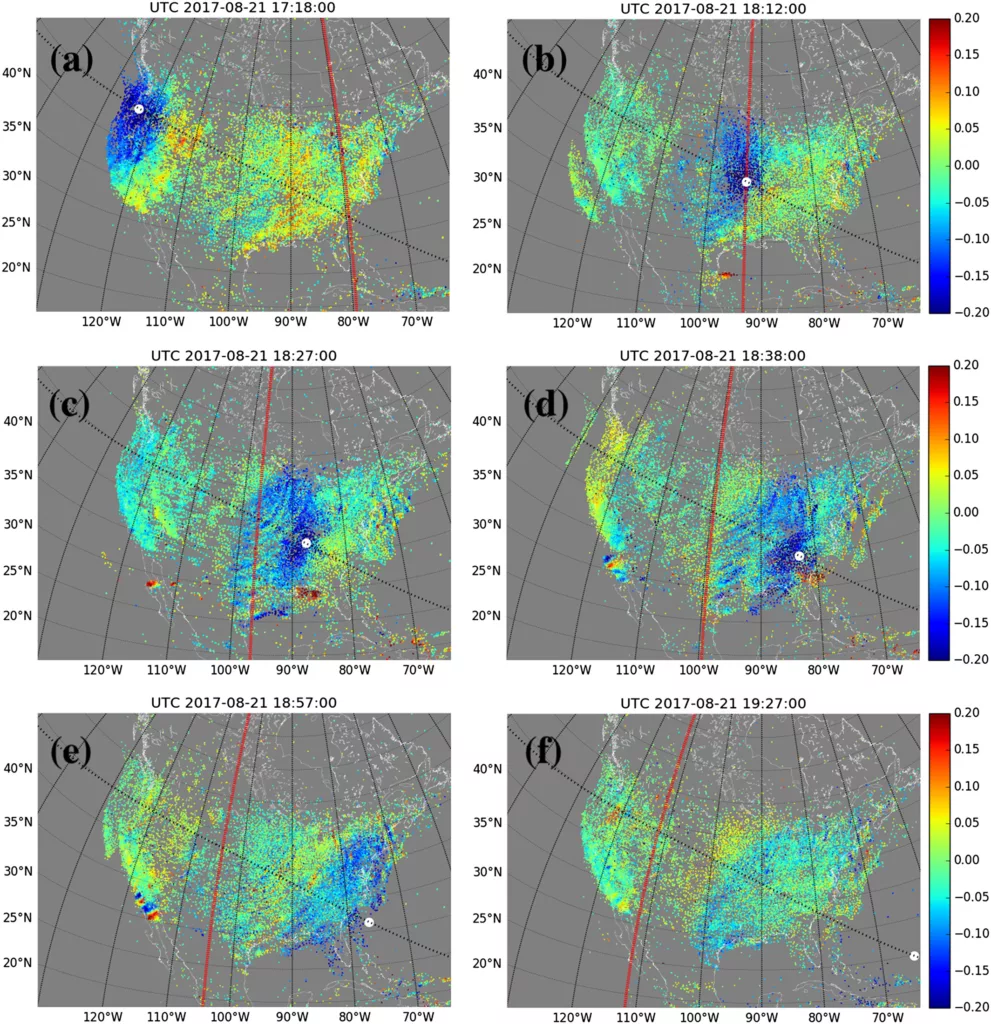
Another kind of atmospheric disturbance was also detected, though in this case it was long-predicted rather than serendipitous. Using models, researchers thought that there should be ionospheric “bow waves” trailing from the eclipse shadow, analogous to the waves created by a boat. But this effect was too subtle to be picked up in the coarse observations collected during past eclipses. But with improved resolution during the 2017 eclipse, these bow waves were observed quite clearly.
To continue studying these phenomena, the MIT Haystack Observatory team submitted a custom data request from the NSF GAGE Facility operated by EarthScope. In addition to a handful of Network of the Americas stations in or near the path of totality, there are some independent networks in the region that archive their data with NSF GAGE. Data collected at a 1-Hz sample rate from stations in the Network of the Americas, the Mid-America GPS Network, and the HoustonNet network are being archived to support this research.
The team has also deployed fifteen additional GPS instruments along the path of the eclipse—and you can watch the data roll in live on the Haystack Observatory website!
There are many applications for improved understanding of ionospheric behavior. Ionospheric activity can interfere with many kinds of communications signals in addition to GPS. That risk is one reason we monitor space weather so closely. So when an unusual but predictable event like an eclipse comes along, researchers want to learn all they can from it.