


Oceans cover over 70% of the earth’s surface. Naturally, we wonder what lies beneath. Seafloor geophysics encompasses a range of methods used to study and map not only the bottom of the ocean, but also what lies in the spaces between the seafloor and surface.
Seafloor Geodesy
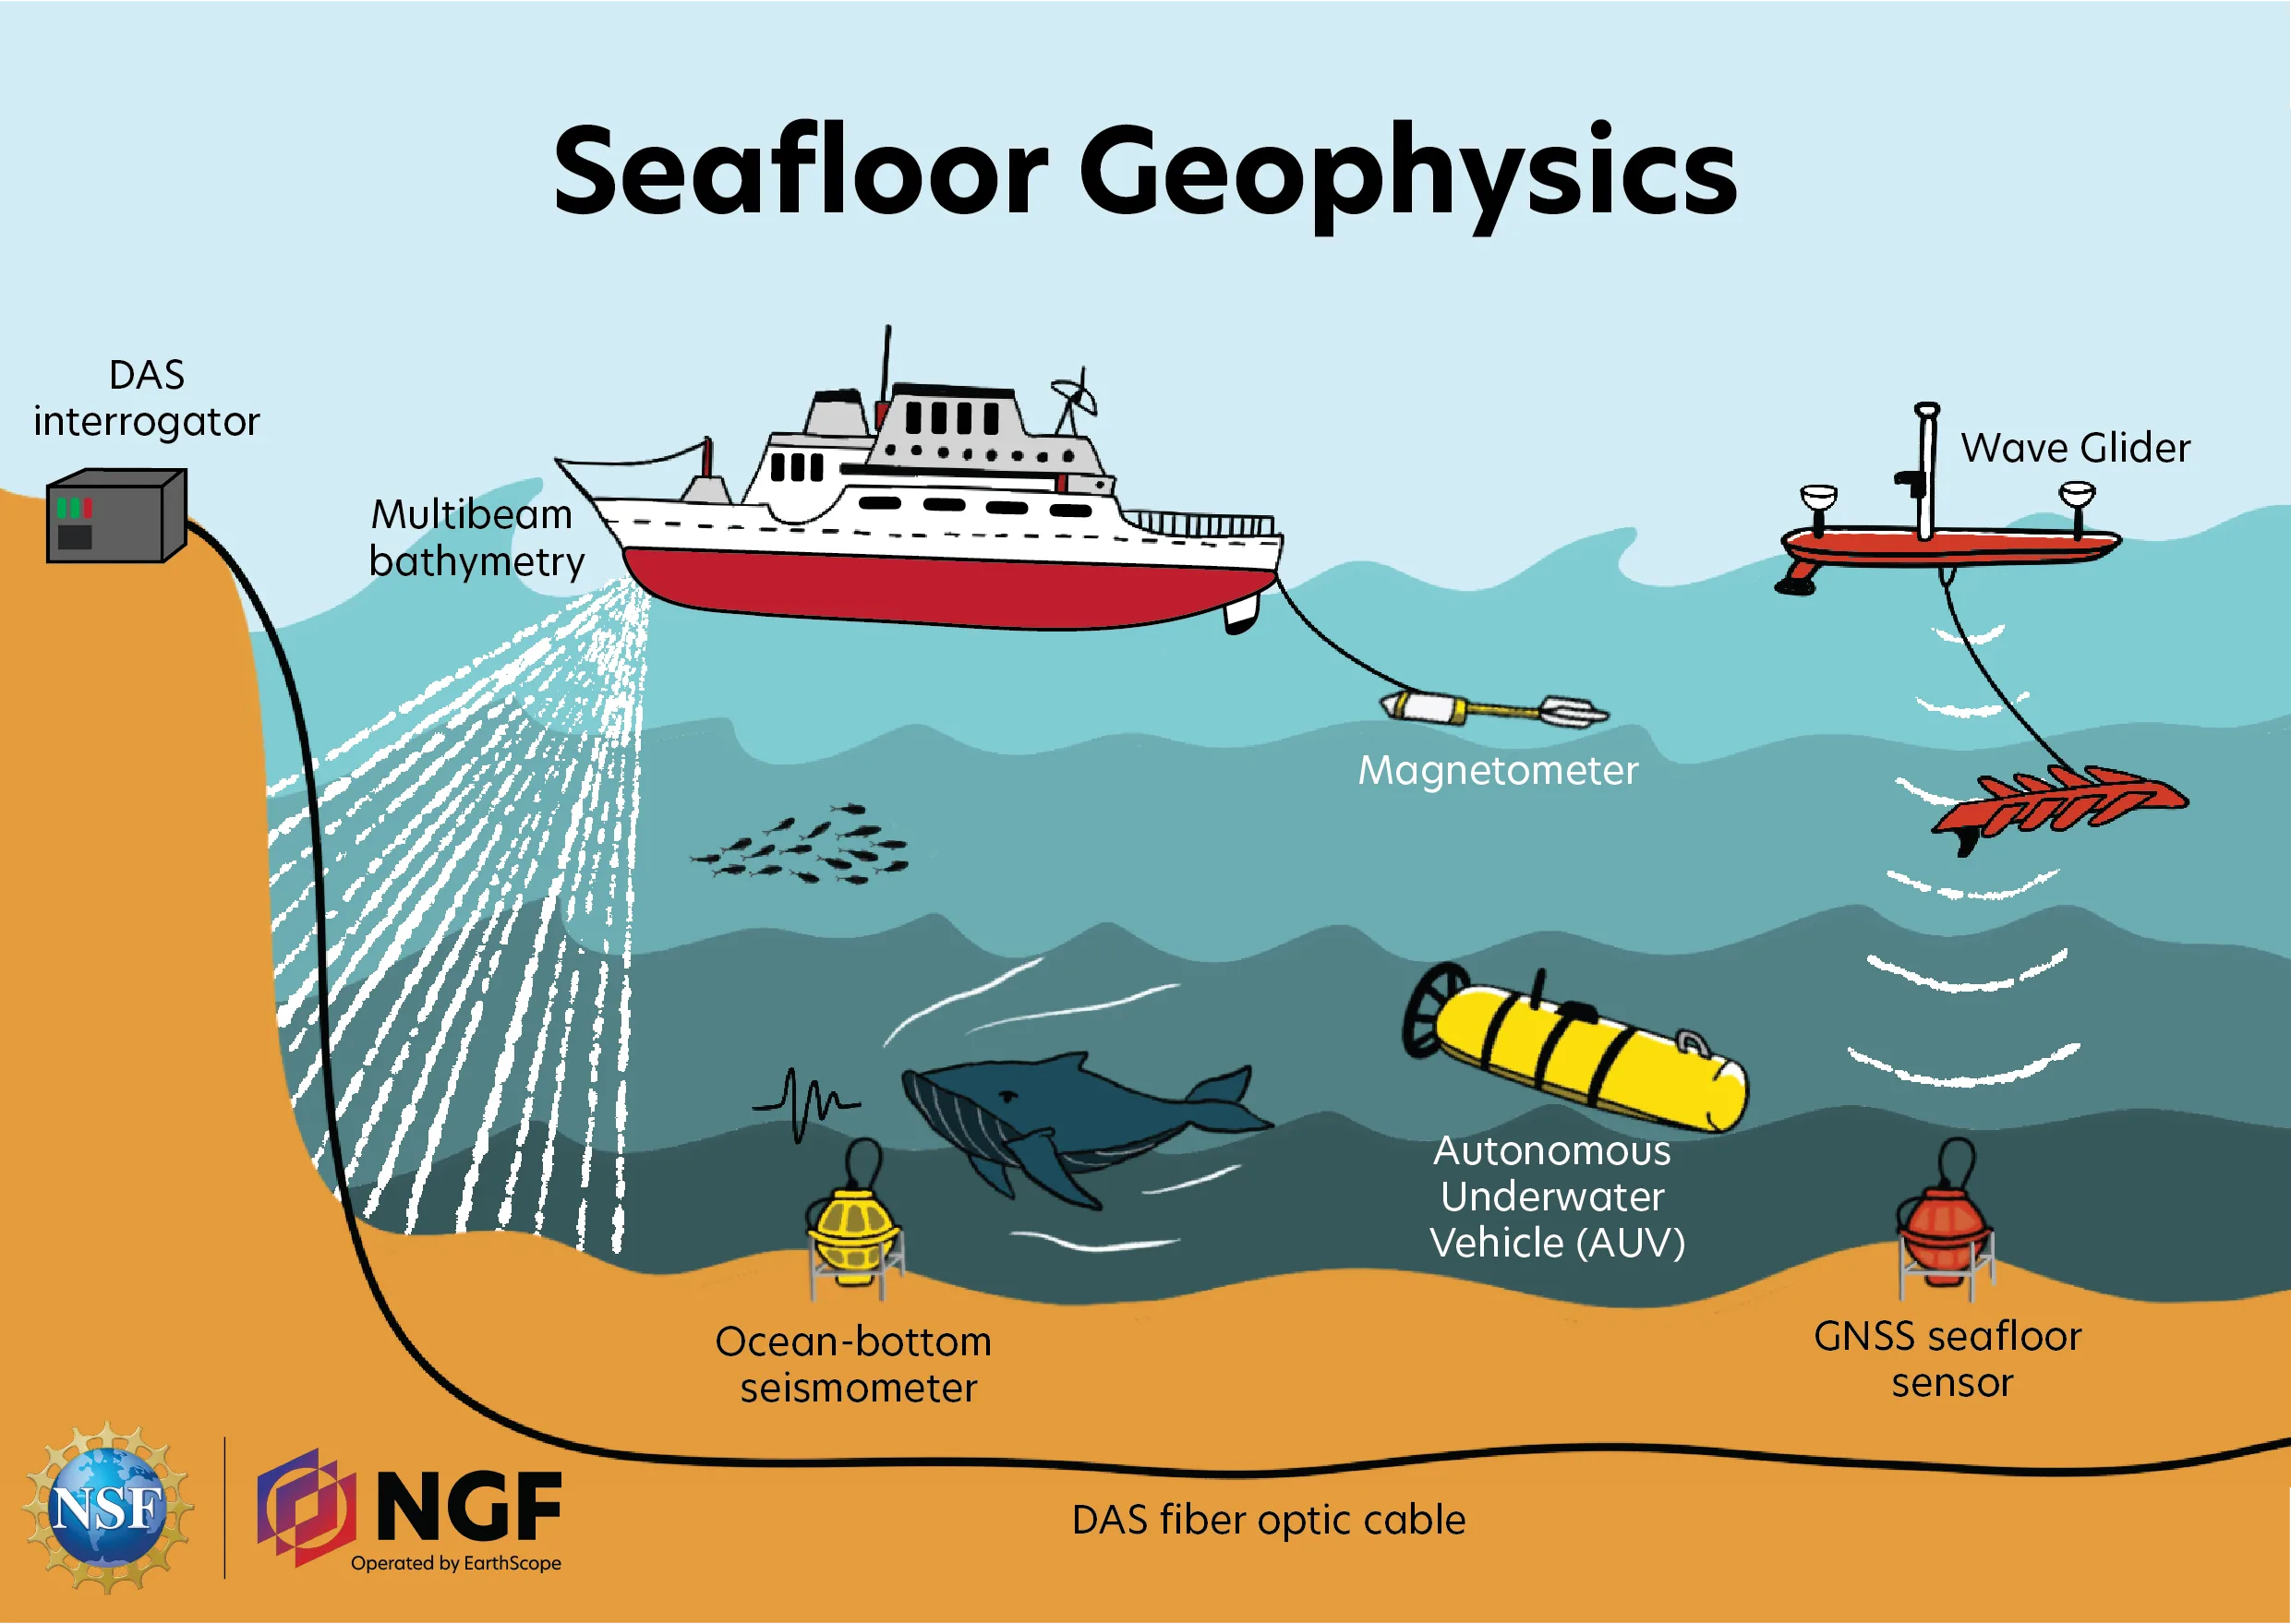
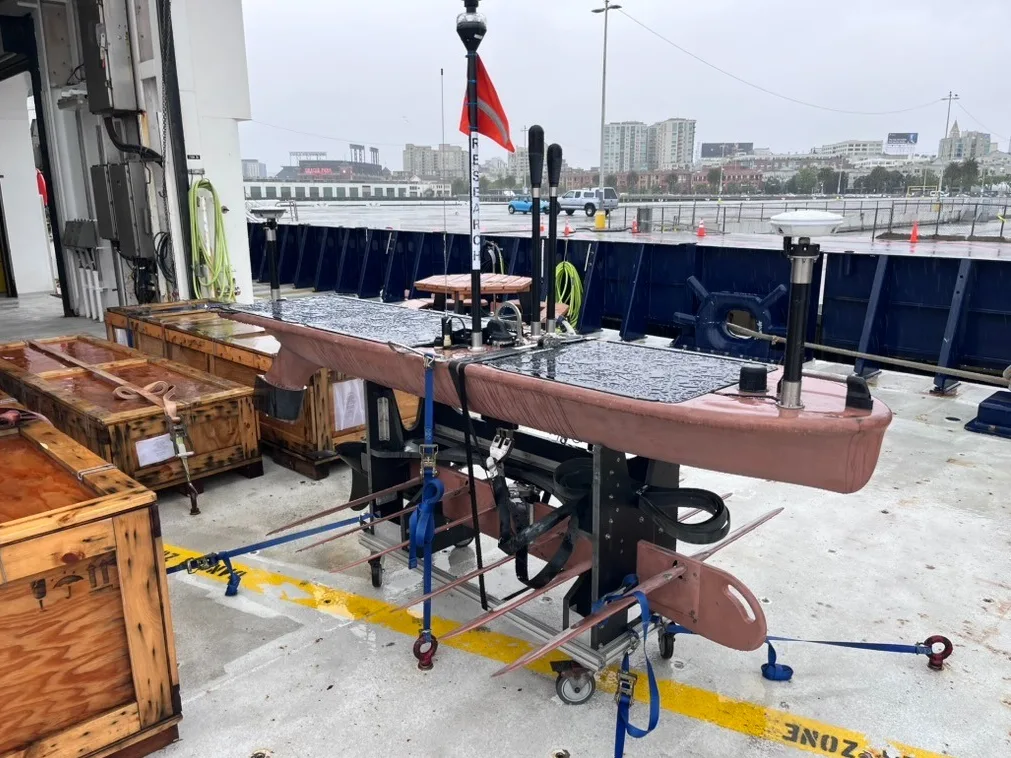
How do we track how the seafloor moves? Geophysicists can’t put regular terrestrial GPS/GNSS stations on the ocean floor since the satellite signals they receive on land can’t travel through water. However, sound waves can! A semi-autonomous surfboard-esque drone, called a Wave Glider, travels along the sea surface attached to a submarine glider that uses wave motion to propel it forward. The Wave Glider can have a suite of instruments mounted on it, including an acoustic device, which can send and receive sound waves. These signals can then be received by anchored GPS sensors, which in return send out a response signal to the Wave Glider. The travel time of these acoustic pulses is what allows geophysicists to track the position of the seafloor with high precision. The Wave Glider also houses a GPS antenna and receiver, so that it can act as a liaison between the seafloor and space, thus communicating the information it receives.
Applications include: measuring shifts in tectonic plates, underwater volcanic activity, and seafloor spreading; understanding earthquake generation and tsunamis.
Bathymetry Mapping
Multibeam Bathymetry
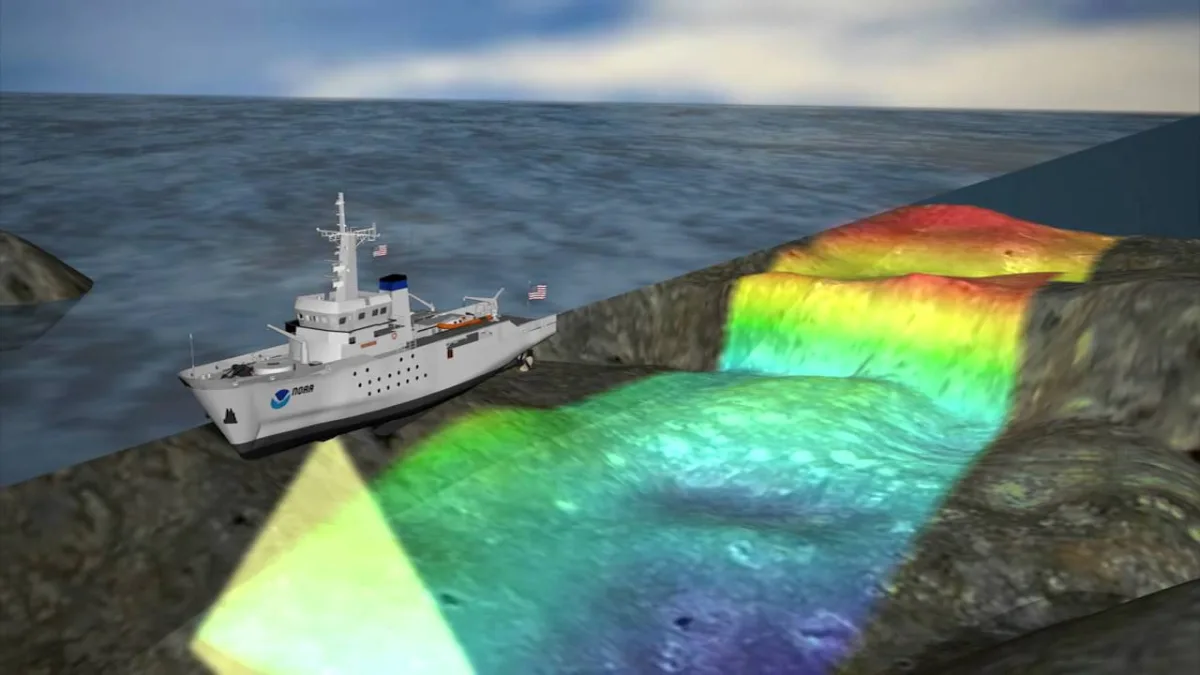
Multibeam bathymetry uses, as its name suggests, multiple beams of sound waves to record ocean bathymetry, otherwise known as underwater depth. Similar to seafloor geodesy, this method involves sending out beams of sound to the seafloor. However, the sound waves are not received by sensors. Instead, by recording how long it takes the sound waves to bounce off the seafloor, we can measure the depth of water. The time taken for the sound waves to return to their source also depends on objects they may encounter in the water column. The array that sends out these sound waves is typically mounted on a ship’s hull.
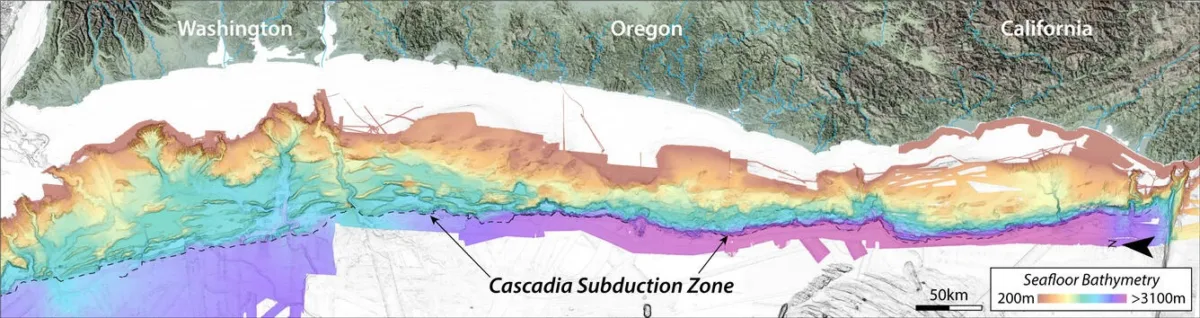
Applications include: providing high-resolution depth data for nautical charting; measuring sediment volumes; monitoring coastal erosion; surveying stable locations for offshore platforms.
Robotic Vehicles
Another method of imaging the complex structure of the seafloor and its variety of landscapes that home marine life is using robotic vehicles. Autonomous Underwater Vehicles (AUVs) and Remotely Operated Vehicles (ROVs) have been used to record topography and subbottom profiler data, perform sonar and LiDAR surveys, and even contain stereo cameras. These robotic tools are able to quantitatively measure change on the seafloor and are available on the MBARI Seafloor Mapping Database.
Precise bathymetric data is crucial for creating maps that help us understand the effects of climate change, monitor erosion, calculate currents and tides, and study marine ecosystems. Just like how we need maps to navigate land, having accurate information about the depth of the water also helps us understand potential hazards to marine transportation for both global trade and passenger transport.
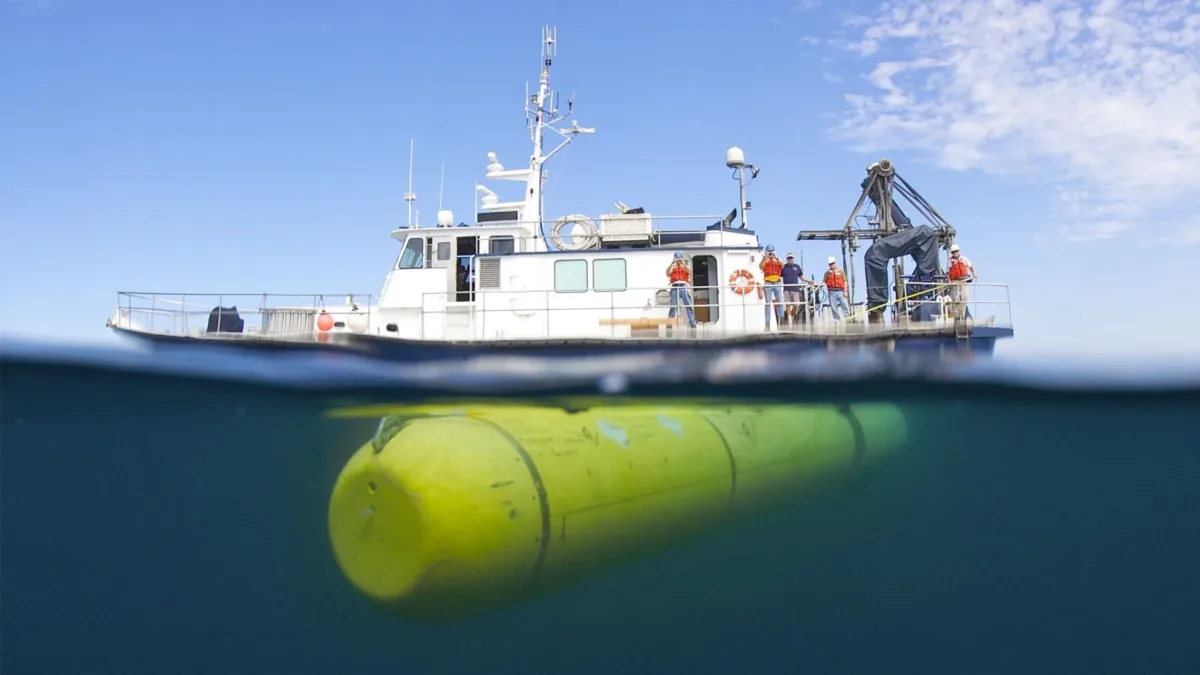
Applications include: producing imagery based on the reflection of sound waves; detecting subbottom layers within sediments; understanding marine ecosystems.
Ocean-Bottom Seismology
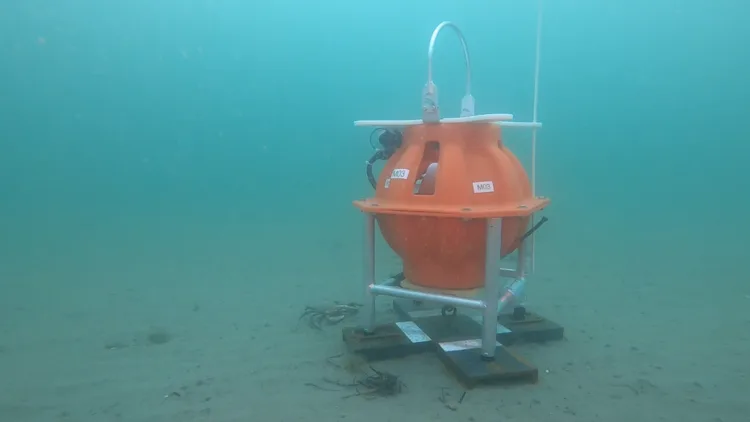
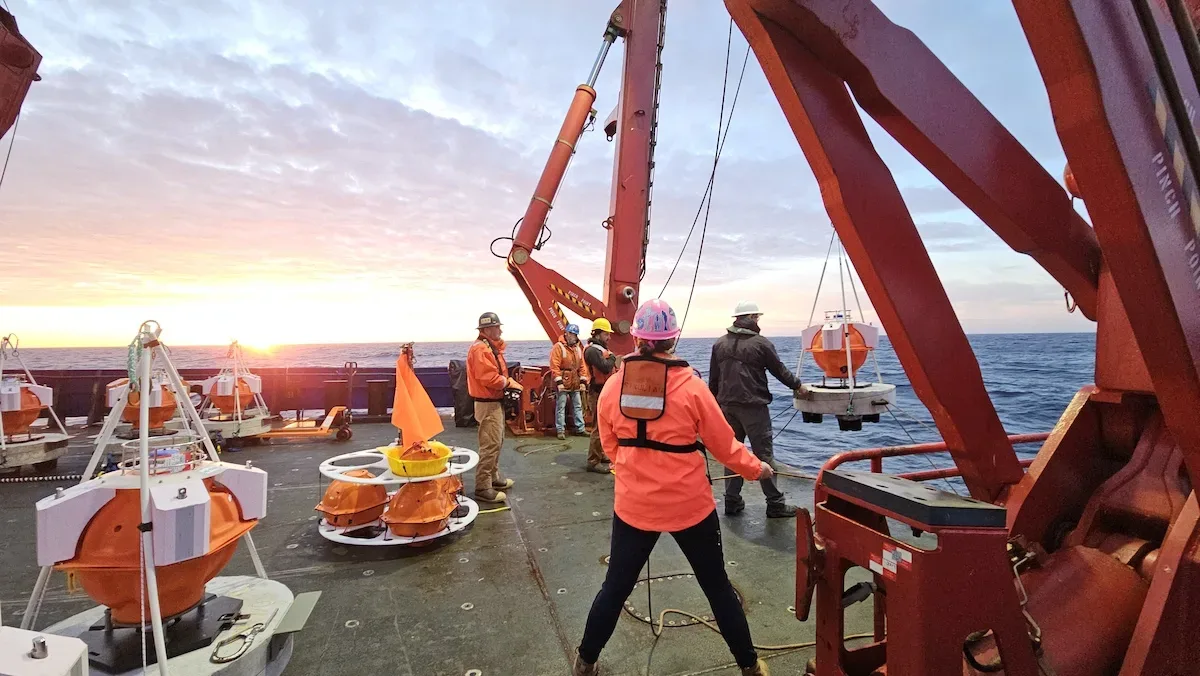
On land, geophysicists utilize seismometers to record shaking and seismic wave propagation. This is not unlike what is done underwater. Globally, more than 80% of significant earthquakes occur around an area known as the ‘Ring of Fire’, which corresponds to the edges of the Pacific Ocean. The closer a seismometer is to the epicenter of an earthquake, the sooner it will detect shaking. This will allow faster earthquake warnings for potentially catastrophic events, where even a few extra seconds of notice can make a difference. Given that so many of these damaging events occur offshore, it makes sense that we would want the seafloor monitored.
However, underwater seismology involves very “noisy” signals. On land, seismometers are installed in remote locations or buried underground to minimize noise pollution from sources such as traffic or human activity. In contrast, ocean-bottom instruments record every slight movement in the water. Every whale, giant internal ocean wave, school of fish, strong current, or underwater earthquake is recorded by these highly precise instruments. Therefore, processing the data afterwards to identify the meaningful signal can be a time-consuming process. However, it is interesting to note that what might be noise to a seismologist may be a signal for a biologist (for example, a whale passing over!)
Applications include: monitoring earthquakes; understanding subduction zone structures; recording subsea landslides; detecting internal ocean wave passage.
Marine Magnetometry
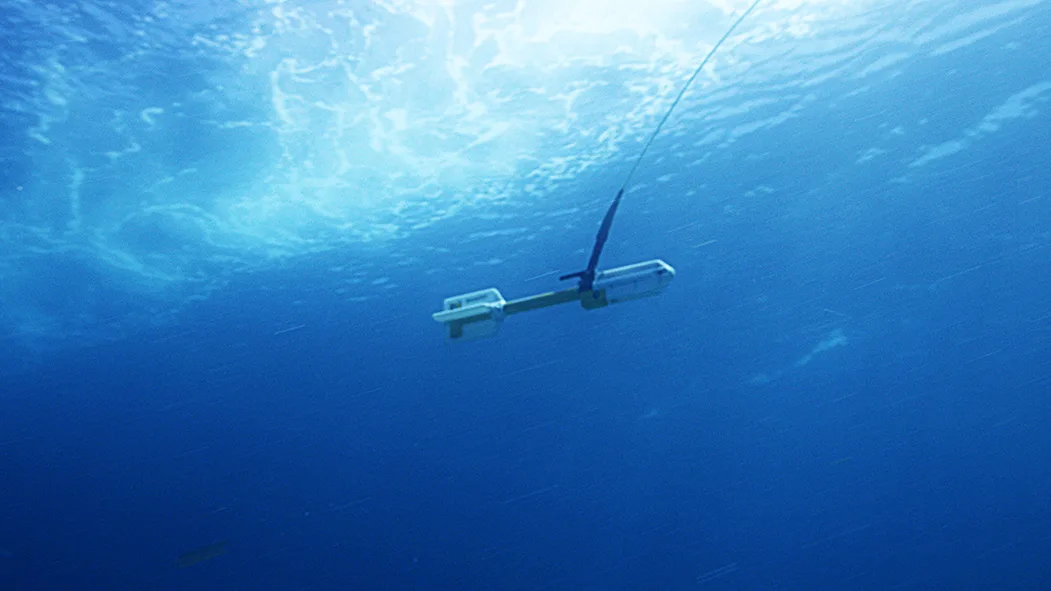
Marine magnetometers are tools used to measure changes in Earth’s magnetic field over the seafloor. The earth’s core contains iron and nickel, which are magnetic elements. As the earth spins on its axis, a magnetic field is generated. The strength of this field varies across its surface and can be measured using a magnetometer.
On an ocean exploration expedition, a magnetometer is often pulled behind the research vessel with a tow cable, although it can also be mounted on an Autonomous Underwater Vehicle (AUV) or aerial drone. When encountering iron-rich objects such as an anchor, a shipwreck, or rock formations with high iron content, the magnetometer records anomalous readings, even if the objects are buried under the seafloor, which cannot be achieved by multibeam bathymetry or ocean-bottom seismometers. These instruments allow us to passively detect magnetic geological units and map the composition of the seafloor, without drilling or extraction.
Marine magnetometers have even helped to redefine geology. In the 1950s, marine magnetometers detected odd patterns of magnetic variations across the ocean floor. It was later discovered that this compass reading distortion was caused by basalt (a highly magnetic mineral) forming at mid-ocean ridges. This became one of the strongest pieces of evidence for seafloor spreading, the process in which new crust is continuously being created along the mid-oceanic ridges.
Applications include: locating archaeological features; mapping lava flows, dikes, and faults; outlining shallow bedrock and sediment patterns.
Distributed Acoustic Sensing (DAS)
DAS uses long fiber optic cables laid along or buried under the ground, either on land or offshore. By sending out pulses of light through the cable using an interrogator, this method detects any disturbance along the length it covers, providing us with continuous sensors along the cable length as if there were millions of mini seismometers deployed. Globally available underwater telecommunication cables can be repurposed for DAS monitoring, reducing the amount of instrumentation and gear needing to be acquired for a geophysical investigation.
Seafloor DAS can also be useful for monitoring subsea infrastructure such as cables and offshore platforms, detecting pipe leakage or reservoirs of fluids (such as oil and gas), mapping soil and rock layers, and even differentiating marine species by the sounds they make!
Applications include: providing spatially continuous data on offshore earthquakes; recording acoustic signature of marine animals; and identifying marine vessels.