Across the world’s oceans, winds can gently blow or scream through a stormy sky. Calm or ferocious, winds rippling over the water’s surface cause waves. Wind-driven ocean waves beat on Earth’s seafloor, creating a continuous signal for which seismic stations around the world listen. This is the microseism—a globally detectible seismic noise created by interactions between ocean and Earth.
In a new article published in Nature Communications, scientists report that by examining how this signal has changed since the 1980s—specifically in its seismic amplitude and energy—they can infer a gradual, general increase in the amplitude of wind-driven ocean waves. In other words, the ocean’s waves are getting bigger. Bigger ocean waves indicate more energy in the ocean generated by storms around the world. The most likely culprit? Our warming world in which a warmer ocean and atmosphere are broadly increasing the intensity of storms and wind over the oceans.
“This global dataset spans over three decades and shows that microseism energy has progressively increased at an average rate of about a quarter of a percent per year,” said Rick Aster, lead author and Professor of Geophysics at Colorado State University. “This is the first study to show a pervasive effect of climate change on seismic signals generated by ocean waves across the Earth.”
A physics aside
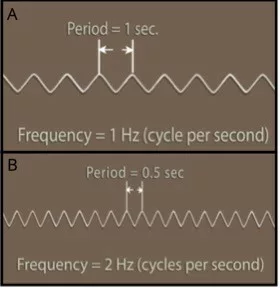
You may wonder what scientists who study waves (not just seismic ones, but any kind of wave—sound waves, light waves, ocean waves) mean when they say “long periods” or “long wavelengths” or “low frequency.” A lower frequency wave has a longer wavelength—the distance between crests (or troughs) is larger. Waves with low frequencies and long wavelengths also have long periods—the time needed to cycle from crest to trough and back.

Another feature of a wave is its amplitude, or how tall the wave is. Surfers love waves with big amplitudes. (Think of the tallest wave ever surfed, which towered 26 meters, or 86 feet, high from its trough to its crest. That’s the height of an eight-story building!) On the other hand, babies (and their parents, probably) may prefer the gentle waves of a sheltered lagoon, with amplitudes on the order of centimeters. Amplitude tells scientists about energy carried by a wave. For instance, when it comes to sound, the more energy the wave has, the greater the amplitude, the louder the sound. So too, with seismic waves, which, like their acoustic cousins, grow in energy as the square of the amplitude.
Winds and waves
Scientists have noted since the late nineteenth century that seismic sensors everywhere on Earth detect a perpetual background signal at periods between about eight and 30 seconds (these are considered “long periods” by seismological convention). By the 1960s, scientists had established that this incessant signal comes from wind-driven ocean waves interacting with the seafloor, where they generate seismic waves that propagate around the globe. By the mid-20th century, further studies established two different processes that create the so-called primary and secondary microseism. The secondary microseism, the stronger of the two by far, results when ocean waves traveling in different directions interfere with one another, creating smoothly swinging changes in seafloor pressure.
The other signal—the more subtle primary microseism—is the focus of Aster and colleagues’ study. As wind causes waves at the ocean’s surface, this motion of the ocean translates through the water column to the seafloor, changing the pressure with each wave’s rise and fall. “Because this direct wave effect tapers strongly with depth, near-coastal waves occurring where ocean depths are less than a few hundred meters are the global source of the primary microseism,” Aster said.
Between periods of 14 and 20 seconds (frequencies of 0.05 and 0.07 Hertz), seismic sensors continuously measure the never-ending seismic waves of the primary microseism. “Because it does not depend on interfering waves (as the stronger secondary microseism does), but simply requires large waves in relatively shallow seas for its generation, the primary signal is an especially good proxy for the energy in near-coastal ocean swells created by Earth’s storms,” Aster explained.
Global dataset
To explore changes in the primary microseism—and ocean waves—over time, Aster and colleagues examined data from the USGS- and NSF- supported Global Seismographic Network (GSN), retrieved from the SAGE data archive operated by EarthScope. The team focused on seismic stations with relatively complete records longer than 20 years. Of the more than 150 GSN stations, 52 were used, with the earliest data collection times for these stations ranging from 1988 to 1999. “These stations were selected solely for their long and continuous records,” Aster said. “And, their locations range from Arctic Europe to Antarctica.”
To ensure that the results reflected ocean wave energy, the team removed certain seismic signals that occur in the same period range as the primary microseism. For instance, large, shallow earthquakes produce seismic surface waves in the 14 to 20 second period band that are measured at seismic stations around the world. To eliminate these earthquake-produced signals, the team removed between three and 48 hours-worth of data associated with earthquakes having magnitudes greater than 5.75, per the USGS ANSS Comprehensive Earthquake Catalog (ComCat). The selection of magnitude 5.75 as the cutoff was a practical choice, according to Aster, because such events, which number more than 200 or so per year, can produce globally detectable surface wave signals at primary microseism periods. The team chose to err on the conservative side when it came to duration of time removed, as seismic surface waves should transit the globe in about three hours, and only the very largest events produce signals that repeatedly round the globe. “At the end of this process we found that these occasional large earthquakes signals from the seismic record didn’t significantly affect the results,” Aster noted.
Energy on the up
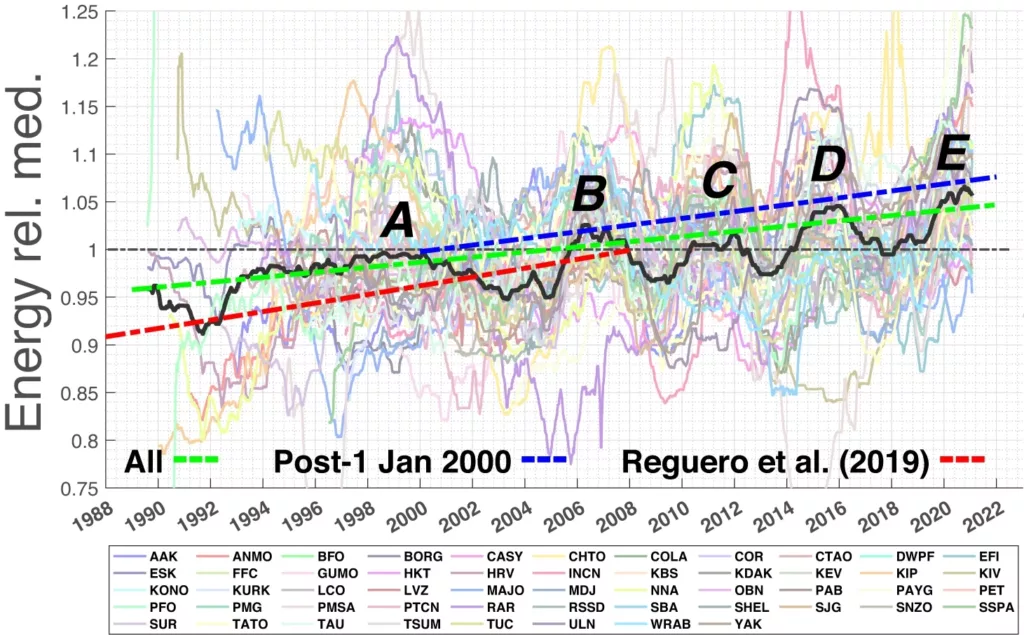
In their examination of decades of primary microseism data from around the world, the team found evidence of increasing seismic amplitudes and energy. Specifically, seismic amplitudes and energy increased across recent decades at 41 of the 52 sites. Moreover, historical variations and increases were similar for close station pairs, Aster said.
The greatest absolute increase in seismic amplitude and energy was observed at the Antarctic peninsula, which the authors note reflects “very high historical median primary microseism levels and perhaps also reflects the influence of variable Antarctic sea ice.” Yet, stations with increased amplitude are globally distributed, and not just confined to the Southern Ocean.
Indeed, the team found that for the entire dataset, seismic and ocean wave energy increased at an average rate of about 0.27% per year. When they looked only at 21st century data, globally averaged energy increased by 0.35% per year. These increases are comparable to those other studies using oceanographic and meteorologic data that have recently estimated wave energy increase since the late 20th century using techniques that are independent of seismic data. Moreover, with recent efforts focusing on digitizing analog seismic records (originally recorded on paper or film), seismic amplitudes—and therefore, ocean waves—can be characterized back in time as far as the early 20th century, as was recently done for coastal California using long-term records recorded near Berkeley beginning in 1931. In future work the team hopes to further investigate the history of ocean energy in the seismic record and to use the worldwide stream of seismic data to estimate global microseism and ocean wave energy in near real time.


