

When features below Earth’s surface aren’t easily visible, geophysicists turn to their multi-disciplinary toolbox for answers. In a new study led by Jacob Alexander Gochenour, geophysicists took a listen to ambient noise with seismometers to map out the complex structure of a Florida aquifer.
The Floridan Aquifer System is an important source of drinkable water for more than half of the population of Florida. This is a type of aquifer called a karst aquifer because it is mainly composed of carbonate rocks such as limestone and dolomite. These types of rocks are highly susceptible to dissolving, and over time, features such as sinkholes and caves are likely to form. However, these open pathways mean that surface pollutants can more easily seep into the water within the aquifer. This contamination of the aquifer system threatens its viability as a source of reliable drinking water for those living in Florida.
Mapping karst aquifers is extremely important for understanding which parts of the aquifer are more vulnerable to dissolution, and therefore are more at-risk to becoming contaminated. Karst aquifers are difficult to map because the presence of open pathways is highly variable from place to place. To circumvent this problem, Gochenour and his team used ambient noise tomography to help fill in the blanks.
Ambient noise tomography relies on detecting “random” seismic noise from sources such as human activities (like traffic) and environmental processes (such as wind, ocean waves, or temperature swings) that can create their own detectable seismic signals. These activities generate vibrations that pass through the ground. As the seismic waves are detected by seismograph stations, a 2D velocity structure of the rocks below the surface can be created. Seismic waves travel through different materials at different speeds – in this case, the wave speeds are determined by the different rock layers of the aquifer system. When the waves are detected by the station seismometers, they can be used to map out the various types of rock within the aquifer. The resulting map is known as a tomographic map—and including data from many stations can increase the resolution of that map.
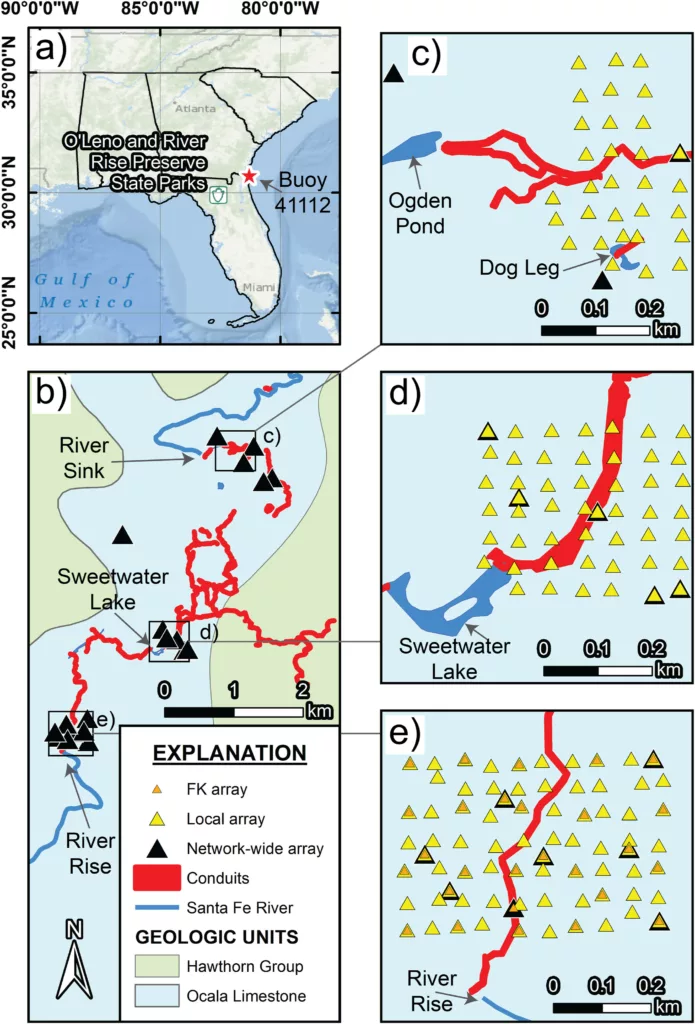
In the case of this study, the team looked at seismic waves generated by traffic along nearby roadways and from local environmental fluctuations. The team collected 30 days of seismic data from a nearby seismograph network.
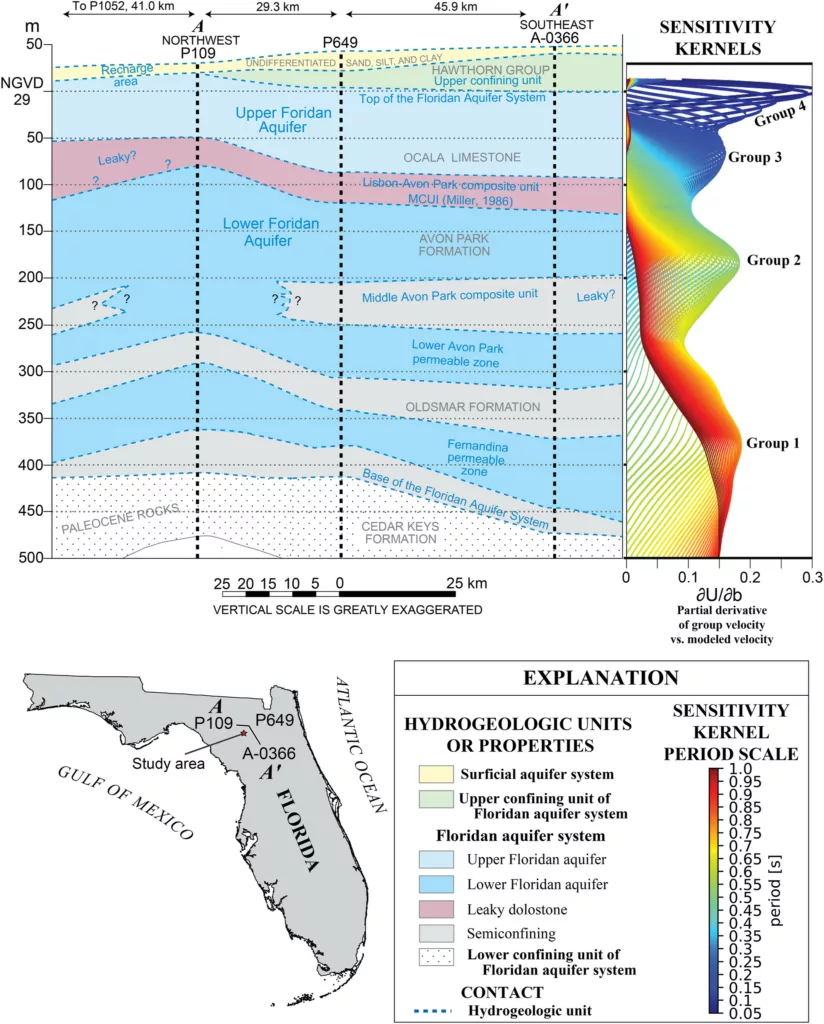
Gochenour and his team were able to pick out several layers that matched hydrogeologic cross-sections previously mapped. By comparing the tomographic data with the known layers of the aquifer system, the team was able to interpret where in their own data layer boundaries between rock types were recorded. They found that areas where seismic wave velocity was relatively slow corresponded to the more permeable limestone layers, while areas with higher velocity mapped well with less permeable dolomite layers.
This study was a proof of concept work, finding that the technique can successfully be used to map subsurface structures and features that would otherwise be hard to identify. By leveraging the ambient sources of seismic waves around their chosen location, Gochenour and team also show that the technique is achievable anywhere where seismic data can be collected, providing another option for mapping other aquifer systems with variable geology.