Many things on Earth become more complex to measure as we try to do so more and more precisely, and sea level rise is no exception. While a single tide gauge record seems relatively straight-forward, regional patterns and land motion make quantifying global average sea level rise a much larger task. Tracking each of the contributors to sea level rise is just as complicated.
For example, estimating the ice lost from the Greenland Ice Sheet involves the use of a suite of techniques, ranging from measurements by satellites to measurements down on the surface. The GRACE satellites measure changes in mass beneath them based on the gravitational pull exerted on the passing satellites. Other satellites measure small changes in the surface elevation of the ice to see where it is thickening or thinning. And other methods use weather data ice flow velocity to estimate mass change with an input-output budget.
Each method has its strengths and weaknesses, so they complement each other to build a more complete picture. A recent paper in Geophysical Research Letters led by Valentina Barletta at the Technical University of Denmark adds another method—this one based on a network of GPS stations.
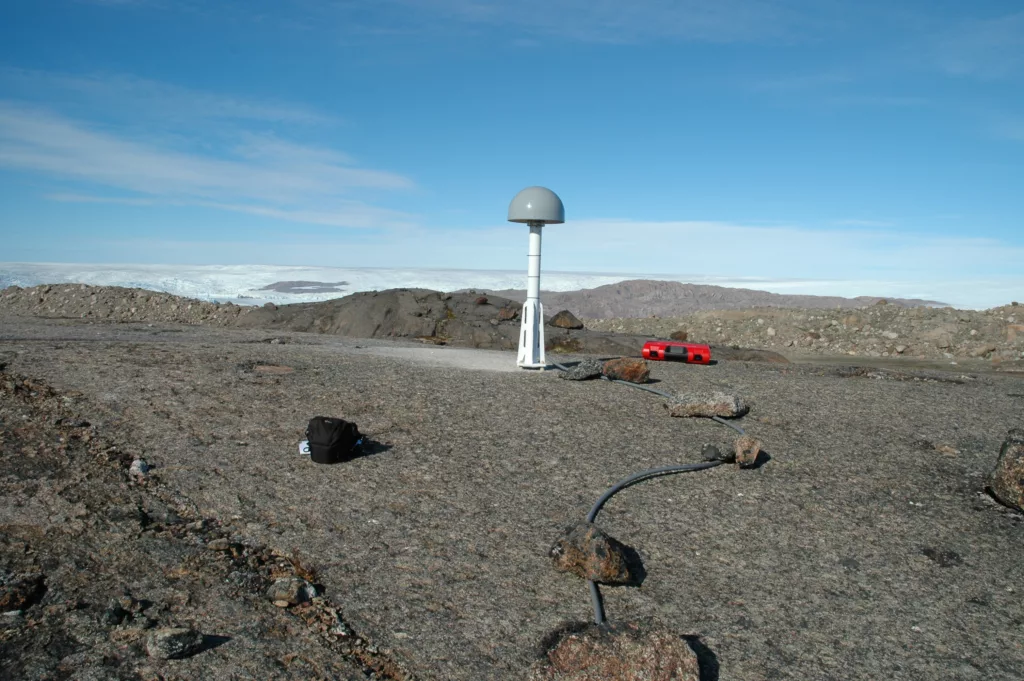
A network of GPS stations (also known as GNSS when they utilize multiple navigation satellite constellations) called GNET rings Greenland, allowing us to measure the subtle vertical bedrock movement caused by changes of the massive ice sheet. The network is currently managed by the Technical University of Denmark and the Danish Agency for Data Supply and Infrastructure, with maintenance and data archiving support from the GAGE Facility operated by EarthScope.
Two processes drive the vertical bedrock movement, with differing timescales. One is elastic deformation—rock slightly compressing or springing back due to changes in the overlying mass of ice. This is a measurable consequence of modern ice loss. The other process is isostatic rebound—the buoyancy-like behavior of Earth’s less-dense crust above the more-dense mantle. Add weight and the crust “floats” lower; remove weight and it rises. This rebound is still gradually occurring in response to the shrinkage of the ice sheet from the peak of the last glacial period over 20,000 years ago.
An important part of calculating modern Greenland ice loss is accounting for that inherited isostatic rebound, which GPS stations on bedrock near the coast are useful for.
Weighing an ice sheet
The GNET GPS stations, as well as other GPS stations placed on the ice, have often been used to study individual outlet glaciers—portions of the Greenland Ice Sheet. But in this study, the researchers decided to try treating the entire GNET network as a single instrument sensitive to changes of the ice sheet as a whole. In essence, the network turns Greenland’s bedrock into a scale that weighs the ice it’s carrying.
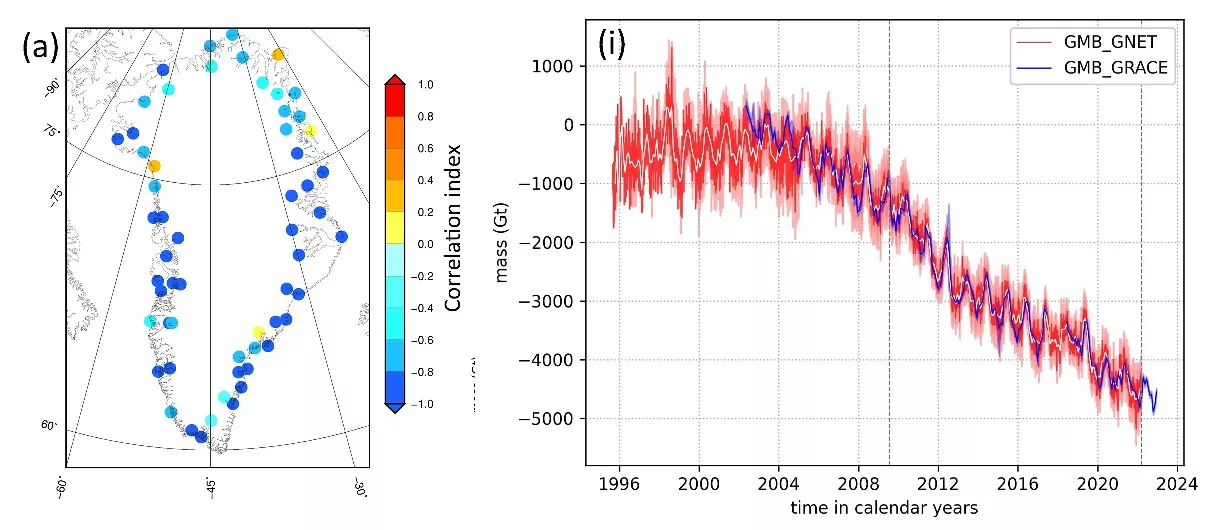
To do this, the team needed to calculate the average relationship between millimeters of bedrock uplift and tons of ice mass loss. First, they simulated the elastic uplift at each station’s location based on the satellite records of ice change. In this model, the network of stations was able to cleanly track the overall ice mass loss, with about 1 millimeter of average uplift per 54 billion tons of ice lost.
Applying that relationship to the real-world GPS station data also shows a good match with the gravity satellite record on short timescales—following the year-to-year wiggles. So the network-as-an-instrument approach appears to be effective.

Precisely separating out the gradual uplift caused by long-term isostatic adjustment to past ice loss and the gradual uplift caused by modern ice loss is still a challenge. Looking at the 2009-2022 time period with the most complete GPS data, this analysis estimates that about 2.6 millimeters per year of the total 6.9 millimeters per year of uplift is isostatic adjustment to past ice loss. (Existing models of the isostatic adjustment range from 0.8 to 3.3 millimeters per year.) The remainder equates to about 230 billion tons of ice currently being lost each year.
Adding another technique that measures this loss in a different way will help improve our knowledge. Combining information from multiple techniques should make it easier to dial in the effect of long-term isostatic adjustment. Because it’s based on daily GPS data, this record offers higher resolution in time than something like the monthly GRACE satellite record—and higher resolution often reveals new insights. It also offers another record to sew up the 2017-2018 gap between the original GRACE satellites and the GRACE-FO satellites that replaced them.
All that makes this network of stations even more valuable, the researchers write: “Our analysis also makes clear that a stable, reliable, and suitably spatially designed GNSS network has a value that outweighs the value of its individual stations, and it is resilient to common challenges such as intermittent availability of the individual stations and changes in the spatial patterns of the phenomena.”

