


It’s often said that volcanoes give plenty of warning before they erupt. But what are these precursor signs? Depending on the volcanic context — a hotspot volcano with watery lava like Kīlauea in Hawaii or a violent stratovolcano like Mt. Pinatubo in the Philippines — they can include earthquakes and surface deformation, pooling lava in a caldera, increased and new gas emissions, or steam eruptions.
These signs can be observed and monitored through a variety of techniques like GPS stations, seismometers, tiltmeters, and satellite remote sensing. But sometimes these eruption precursors can happen over the course of years or be seemingly nonexistent, making their real-time interpretation of imminent eruption difficult to near impossible.
And the ability to keep tabs on a volcano’s likelihood of eruption is pivotal for preparing for the resulting geohazards. About ~853 million people live within 100 kilometers (~60 miles) of active volcanoes — about 10% of the world’s population — and 50% of them live in cities, with this proportion expected to continually increase. That means volcanic eruptions, when they happen, have the potential to spell disaster. Lava flows, swift-moving volcanic debris flows called lahars, and falling ash all have the ability to cause mass fatalities, decimate infrastructure, and threaten livelihoods. So geophysical tools used to track the rumblings of volcanoes are essential for resolving the warning signs of potentially dangerous volcanic activity, effectively bolstering hazard preparedness and saving lives.
A recent study led by Elizabeth Johnson as part of their dissertation work at Penn State used repeat satellite imagery of Volcán Masaya in Nicaragua to connect broad deformation signals with observations of the volcano’s activity over the last decade. Masaya is an active volcano dangerously close to Nicaragua’s capital city, and ultimately this study helps broaden understanding of the volcano’s poorly-constrained underground plumbing system, and potentially inform local hazard planning.
An incandescent caldera
Nicaragua is a Central American country located on the vast volcanic arc that spans from Guatemala to Panama, resulting from the Middle America Trench. Here, the Cocos Plate is swallowed beneath its neighboring South American Plate in a process called subduction. The trench is an area of plate recycling, where the massive lithospheric slab of the Cocos melts at depth and produces the chain of volcanoes behind the trench.
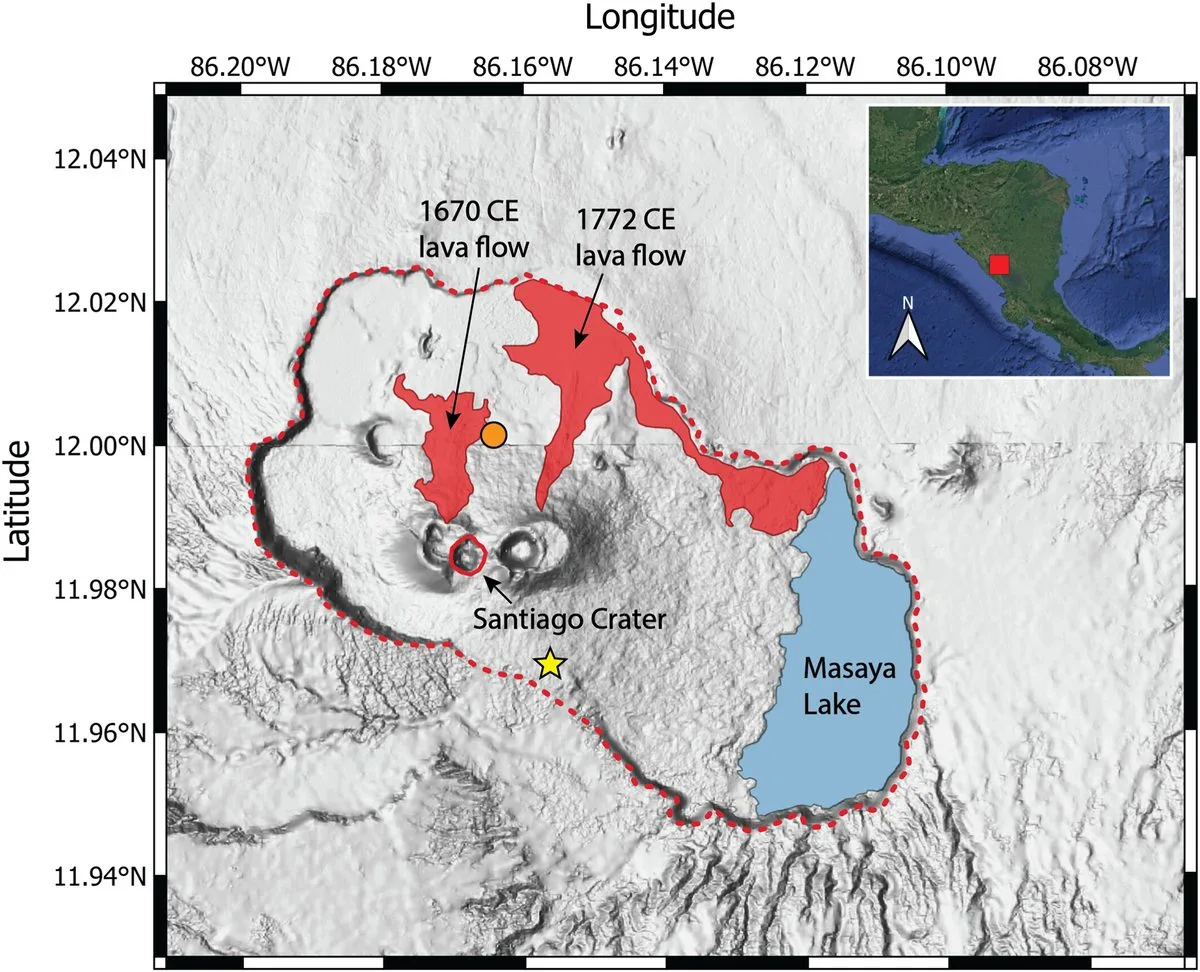
Volcán Masaya has been a fixture of Central American volcanology as one of Nicaragua’s most active volcanoes. Masaya is actually a caldera complex, hosting several calderas and craters that have sporadically erupted — sometimes violently — over the course of the recent geologic past. One of the calderas, Santiago, currently hosts a lava lake that ebbs and flows with activity, and draws nearly 300,000 tourists each year. Santiago’s most recent era of activity started up again in 2015, punctuated by gas emissions, nighttime incandescence of the lava lake, seismicity, and the occasional ash plume.
Masaya is also pretty easy to get to because it’s only 20 kilometers from Managua — and it’s a national park. While convenient for tourism, this also means that the nearly two million people living in Managua and surrounding areas face the threat of volcanic eruption, making it a volcano to watch closely.
Evidence in both the geologic and historical records point to a violent past, with the most recent event, a VEI 1 caldera floor explosion, recorded in 2001. While no deaths or injuries occurred, it’s a prime example of the volcano’s unpredictable behavior. Volcanologists have also discovered evidence of at least four Plinian-style eruptions over the last few millennia, indicating the volcano’s ability to change its eruptive style. These eruptions are cataclysmic, spewing large amounts of both magma, rock, and ash, and sending raging pyroclastic flows down the volcano’s slopes. Famous examples of Plinian eruptions are the 1980 Mount St. Helens eruption, the 1992 Mount Pinatubo eruption, and the eruption of Mount Vesuvius that covered the Roman town of Pompeii in ash.
But volcanic caldera complexes like Masaya cover vast swathes of area at the surface, and much of what drives their surface expressions are below, where their “plumbing systems” can extend to depths of hundreds of kilometers. So how do volcanologists get the big picture?
Seeing below — from above
A remote sensing technique called Synthetic Aperture Radar, or SAR for short, allows orbiting satellites to take very highly detailed images of Earth’s surface from above. The technique bounces microwave light off the planet’s surface to create a two-dimensional image, resolving topography down to the centimeter-scale, making it perfect for illuminating the subtlest signs of deformation.
If two or more passes by the satellite over the same area are obtained, it becomes InSAR — Interferometric Synthetic Aperture Radar — and the images can be compared to tell if any changes in the surface have happened between the two captures, like surface rupture from a fault or ground subsidence. This is because deformation can lead to a difference in the height of the ground, which affects how the reflecting light is measured. The incoming microwave light will bounce back in a different phase for the second pass compared to the first, and the difference in the phases can be used to determine the difference in elevation. These collections are called either “ascending” and “descending” passes, because they refer to the direction of the satellite’s trajectory — south-to-north for ascending, and north-to-south for descending. InSAR imagery is often captured with the European Sentinel-1 satellite, which is used for broad Earth system observation.
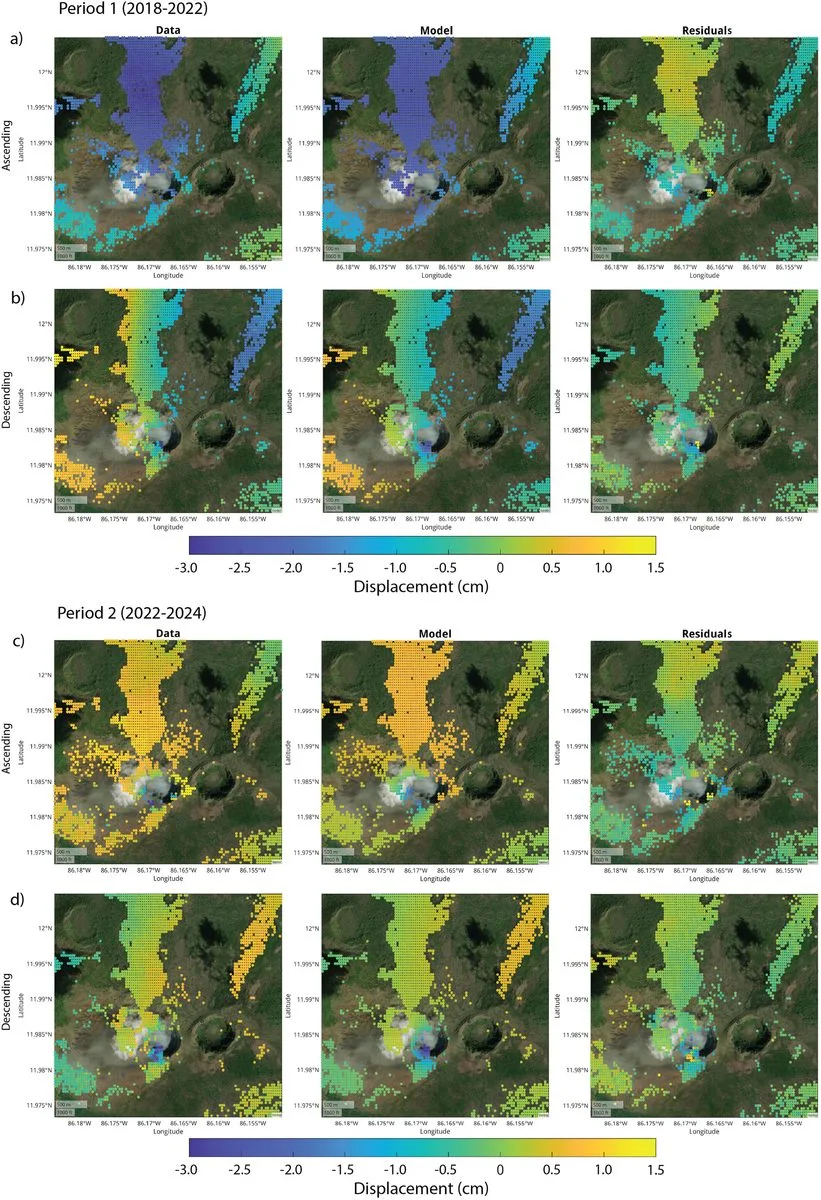
In the study done by Johnson, InSAR imagery of the area around Masaya from January 2018 to February 2024 was analyzed for evidence of surface deformation to explain volcanic behavior observed at Santiago caldera.
Masaya has hosted lava lakes since at least the 1400s. In 2015, the lava lake established at Santiago caldera and exhibited suspicious behavior — increased seismicity, small explosions, and an elevated thermal anomaly detectable by satellites. However, the thermal signal decreased in strength and the lava lake subsided until it was covered by a landslide in 2019.
At the end of 2024, though, activity began increasing again. An ash plume, nighttime incandescence of the caldera, and fumarolic activity were all detectable. Together, these multi-year signals of activity suggested interesting things were happening below the surface.
Combing through pixels for deformation
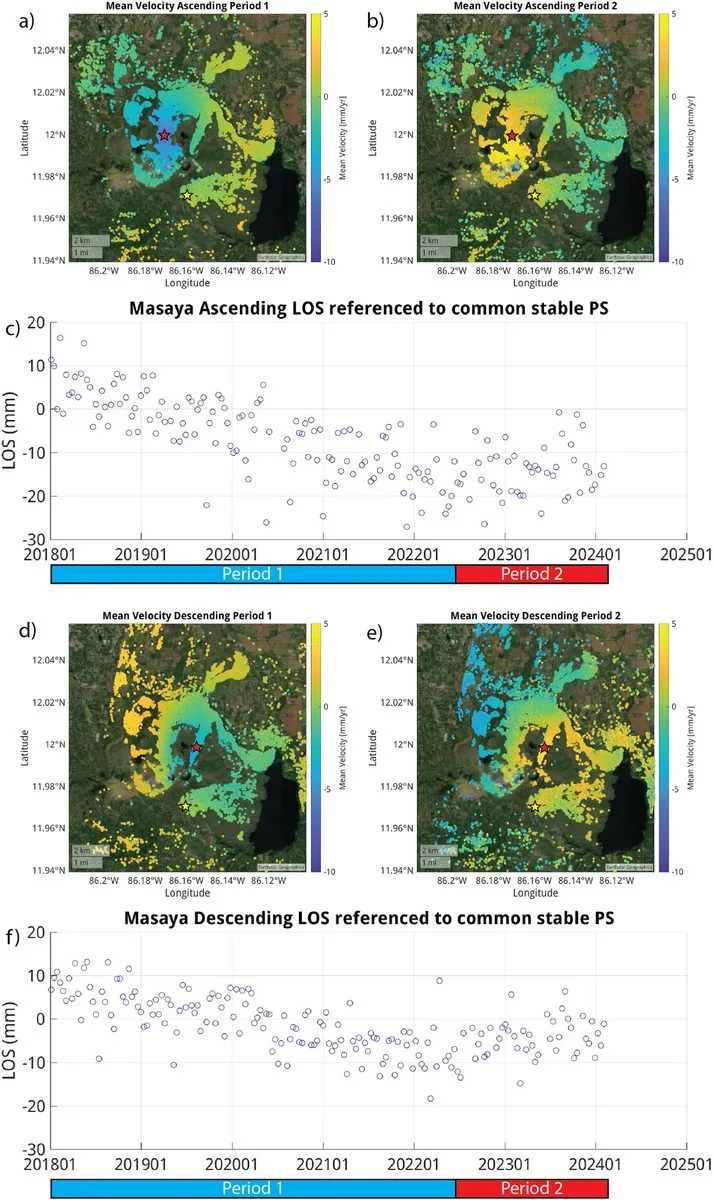
Johnson found a mechanism in the InSAR data that explained the taciturn volcanic activity. By calculating a velocity map of the caldera complex, which shows the annual average ground motion in millimeters per year over a captured area, Johnson found that a period of ground deflation occurred during 2018 – 2022 — when activity decreased — and a period of ground inflation was observed during 2022 – 2024 — when activity began to increase again.
To create not only the velocity maps but also time series for these periods, the average line-of-sight (LOS) displacements of InSAR image pixels covering the central caldera were calculated. This is sensitive, capable of measuring changes of just one millimeter (mm) — a ground deformation signal not detectable by humans, but a powerful indicator of activity brewing below the surface.
First, Johnson combed through the data to find the deformation signatures. This is done by examining the subtracted images for pixels that are significantly different. But because there are millions of pixels, a shortcut is needed to make this easier. An algorithm groups areas of pixels in the InSAR images where not much line-of-sight (LOS) displacement has been detected, and then reduces the resolution of the area in the image. In areas of the imagery where lots of change is detected, the resolution remains detailed.
InSAR gives volcanologists a great picture of the result of changes in a volcano’s subterranean plumbing system, but it doesn’t tell them what causes the deformation. So next, clever mathematical inversions are used to estimate what must be going on below.
A favorite tool of choice is the Mogi model, after Japanese mathematician Mogi who defined the model to describe the deformation at Sakurajima volcano. This model tries to guess at the size, volume, and depth of a spherical pressure point-source buried below the area of deformation, and match the model to the observed extent of deformation from the InSAR data.
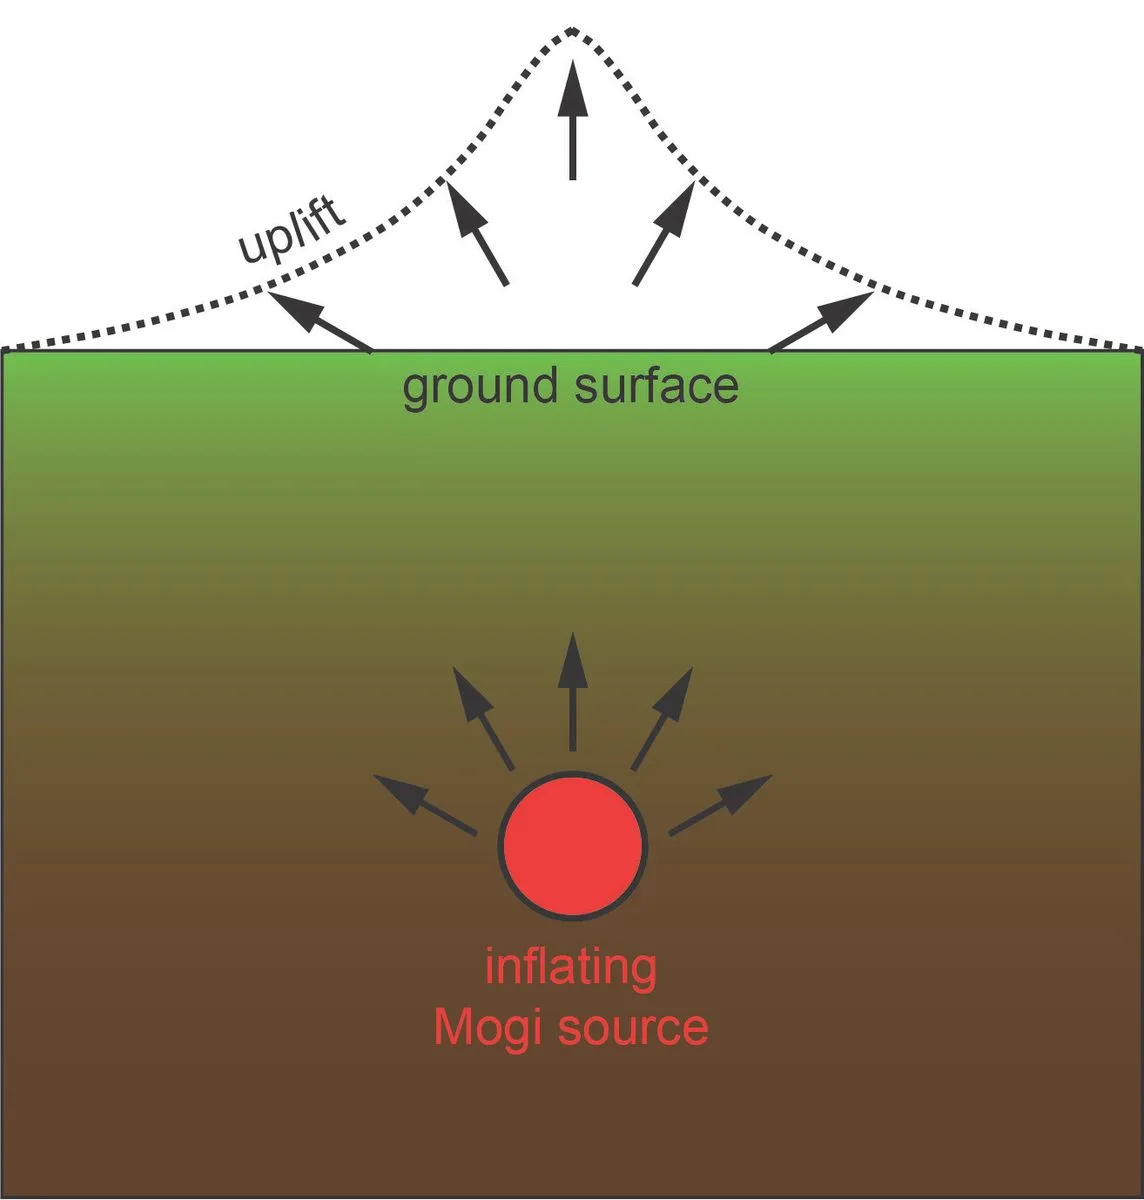
Using the Mogi point-source method, Johnson and team proposed that the point source is the Masaya Central Reservoir (MCR), a known body of magma pooled below the active Santiago caldera. Using the best Mogi model inversion of the data, it’s likely that the MCR is ~3200 m below the surface. To explain period 1’s deflation signal, the model estimates a loss of volume of 1.3 x 𝟭𝟬⁶ m³, and for period 2’s inflation signal, a volume increase of 4.5 x 𝟏𝟎⁵ m³.
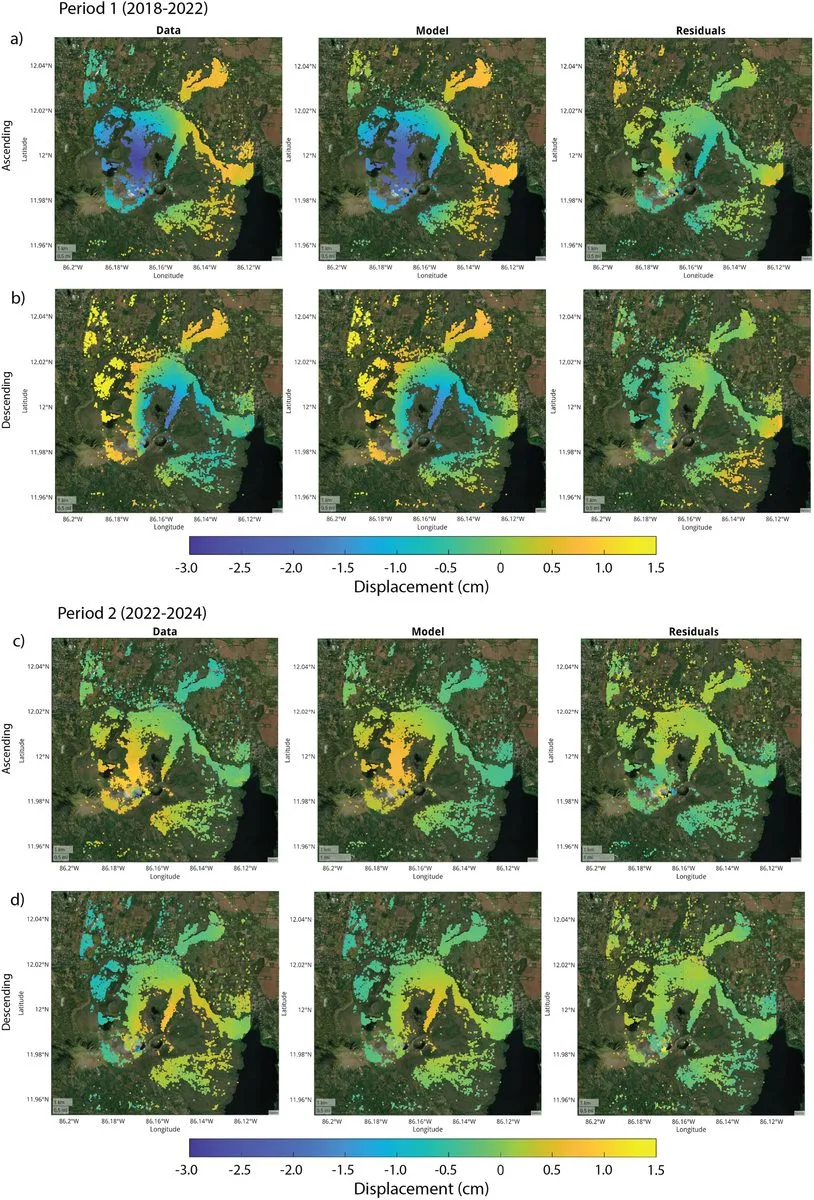
But Santiago hosts a lava lake, which means there is a magma source directly feeding it that should be closer to the surface. This source should also cause deformation, but knowledge of its exact characteristics — like volume and depth — are unknown. So instead of using an inversion, the team used a forward modeling approach to describe how a second magma reservoir could contribute to surface deformation. This approach infers a second, shallower magma reservoir at a depth of 200 m. This source also followed the deflation-inflation behavior of the MCR source, but reversed. Johnson’s results indicate the source increased in volume by 4,000 m³ during period 1 and decreased in volume by 6,000 m³ during period 2. Together, the point sources’ behaviors could suggest a linkage.
Encouragingly, the insight suggested by the geodetic modeling fits well with the results of other data. Geodesy and seismology are not the only methods by which volcanologists can uncover the secrets of a volcanic system. Geochemists, who study the chemistry of volcanic rocks, can uncover a surprising amount of information about the temperature and pressure conditions below the surface from conducting chemical analyses on minerals solidified in lava. Geochemical studies of olivine crystals, a type of mineral commonly found in Earth’s upper mantle and magma chambers, indicate the pressure that the crystal formed at was at a depth of ~4.5 kilometers. Further, seismic tomography studies, which use seismic waves to create a two dimensional image of the subsurface, have revealed the presence of a low-velocity zone (aka a squishy melt area) between 3 and 6 kilometers depth. Both findings are consistent with Johnson’s geodetic work, altogether suggesting that there could be a double reservoir system feeding the Masaya caldera complex.
So what does this mean for the two million people living near this burbling volcano? A chance at better preparation should the volcano switch from effusive to explosive behavior. Since Masaya is capable of these different types of eruptions with vastly different outcomes, new data that reveals a clearer picture of the volcano’s whole system helps to inform the type and level of intervention that emergency managers and hazard mitigation planners need to prepare for. Understanding why and how the volcano is capable of different activity is a problem that can be chipped away at through work like Johnson’s.