


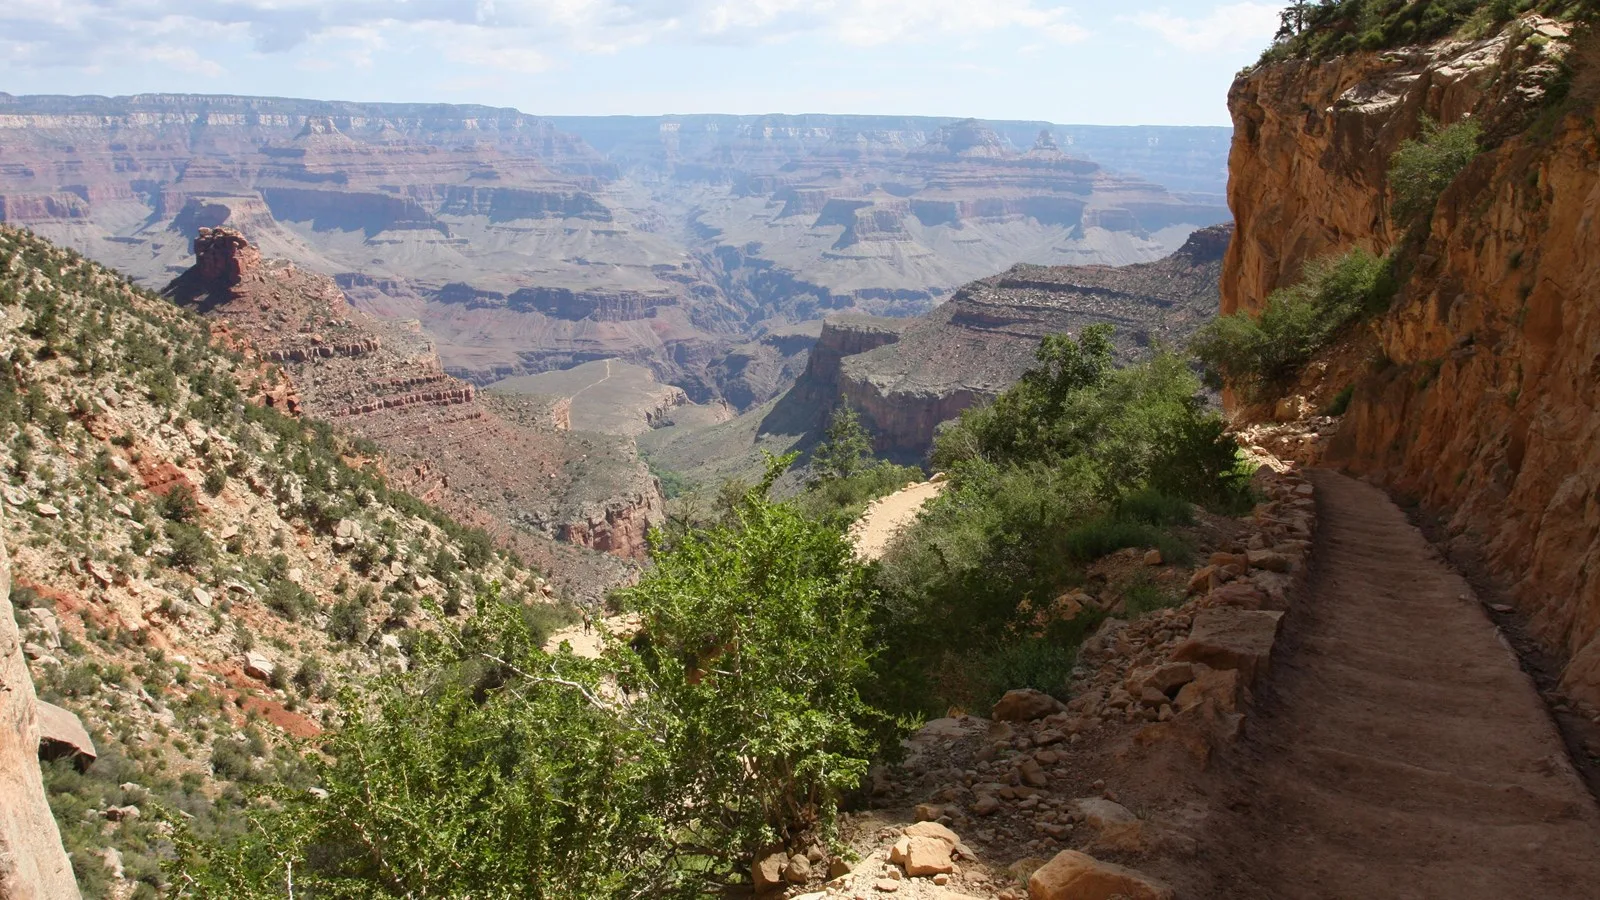
On August 29, 2026, flash flooding in the Grand Canyon caused the deaths of three hikers. More than 80 people were rescued from near the canyon’s bottom as trails, bridges, and other infrastructure — especially in the Bright Angel Creek area — were destroyed. The Transcanyon Waterline, which ferries potable water into the park, suffered serious damage, according to the National Park Service. A second flash flood swept the Bright Angel Creek area on September 16, with no reported injuries.
Although the devastation of the first flood was shocking, flash flooding is not. The southwestern U.S. often experiences sudden onslaughts of water, particularly during monsoon season, which spans July to September. The summer’s heat causes any moist air wafting into the region to convect, leading to intense, extremely localized thunderstorms. The storms dump rain onto soils that may be unable to fully absorb the downpour. When the intensity of rainfall exceeds the soils’ ability to drink it in, overland flow begins. First, tiny, meter-scale (or smaller) channels — rills — start funneling water downhill. Rills feed into ephemeral streams, those channels that flow maybe a few times a year. If the channels capture and concentrate enough water (and their thirsty soils don’t consume it all), they can spawn flash floods.
In a new paper published in Seismological Research Letters, scientists led by Mitchell McLaughlin, a doctoral candidate at New Mexico Tech, explored a key question: Can fiber optic cables that measure strain via a technique called distributed acoustic sensing, or DAS, detect when the patter of rain transforms to a rush of water coursing down a rill? The team found that DAS can identify water flowing in rills spaced less than one meter apart, particularly when paired with rainfall measurements.
Desert rain
Although the deserts of the southwestern U.S. seem to stretch endlessly in all directions, channels slice the landscape, directing occasional rain into the region’s catchments. The most spectacular of these is the great chasm through which the Colorado River flows — the Grand Canyon, and its many subsidiary canyons that twist away from the river’s trunk.
“It can rain all day out in the desert, and you can have no flow in these rills [or] channels because the subsurface just sucks up all the water,” McLaughlin explained.
The trouble arises when something called Hortonian overland flow, the formal term for infiltration excess overland flow, begins. Simply put, when dry soils cannot speedily absorb intense rainfall, water starts to flow overland, first into rills. Rill-flow itself is a low-energy process, but when many rills direct water into larger channels, destructive downstream events can come to pass, sometimes hours after a storm moved through. These are flash floods, which move not only massive amounts of water, but sediment, debris, or anything else in the way.
Tapping rain, coursing water, and clanging debris all produce ground vibrations detectable by seismic sensors. When traditional stations are deployed to listen to rivers, they must be placed away from active channels to keep them from being washed away. But the onset of rill-flow emanates so subtle a signal that it may be missed by a traditional seismic station installed adjacent to, but not within, a catchment.
Enter DAS.
An opportunistic method
Distributed acoustic sensing, better known as DAS, lets scientists take advantage of existing, unused telecommunication fiber optic cables to measure how the ground moves. The method relies on numerous imperfections within the fiber itself. “The imperfections are everywhere along the cable,” McLaughlin said.
An instrument called an interrogator attaches to one end of the cable. This box of math and physics (and seemingly magic) sends a pulse of light down the cable. As the light hits the imperfections, some of it bounces back to the source. “You have some idea of where along the cable that [bounce] happened, based on how long it takes, because everything’s moving at the speed of light,” McLaughlin explained.
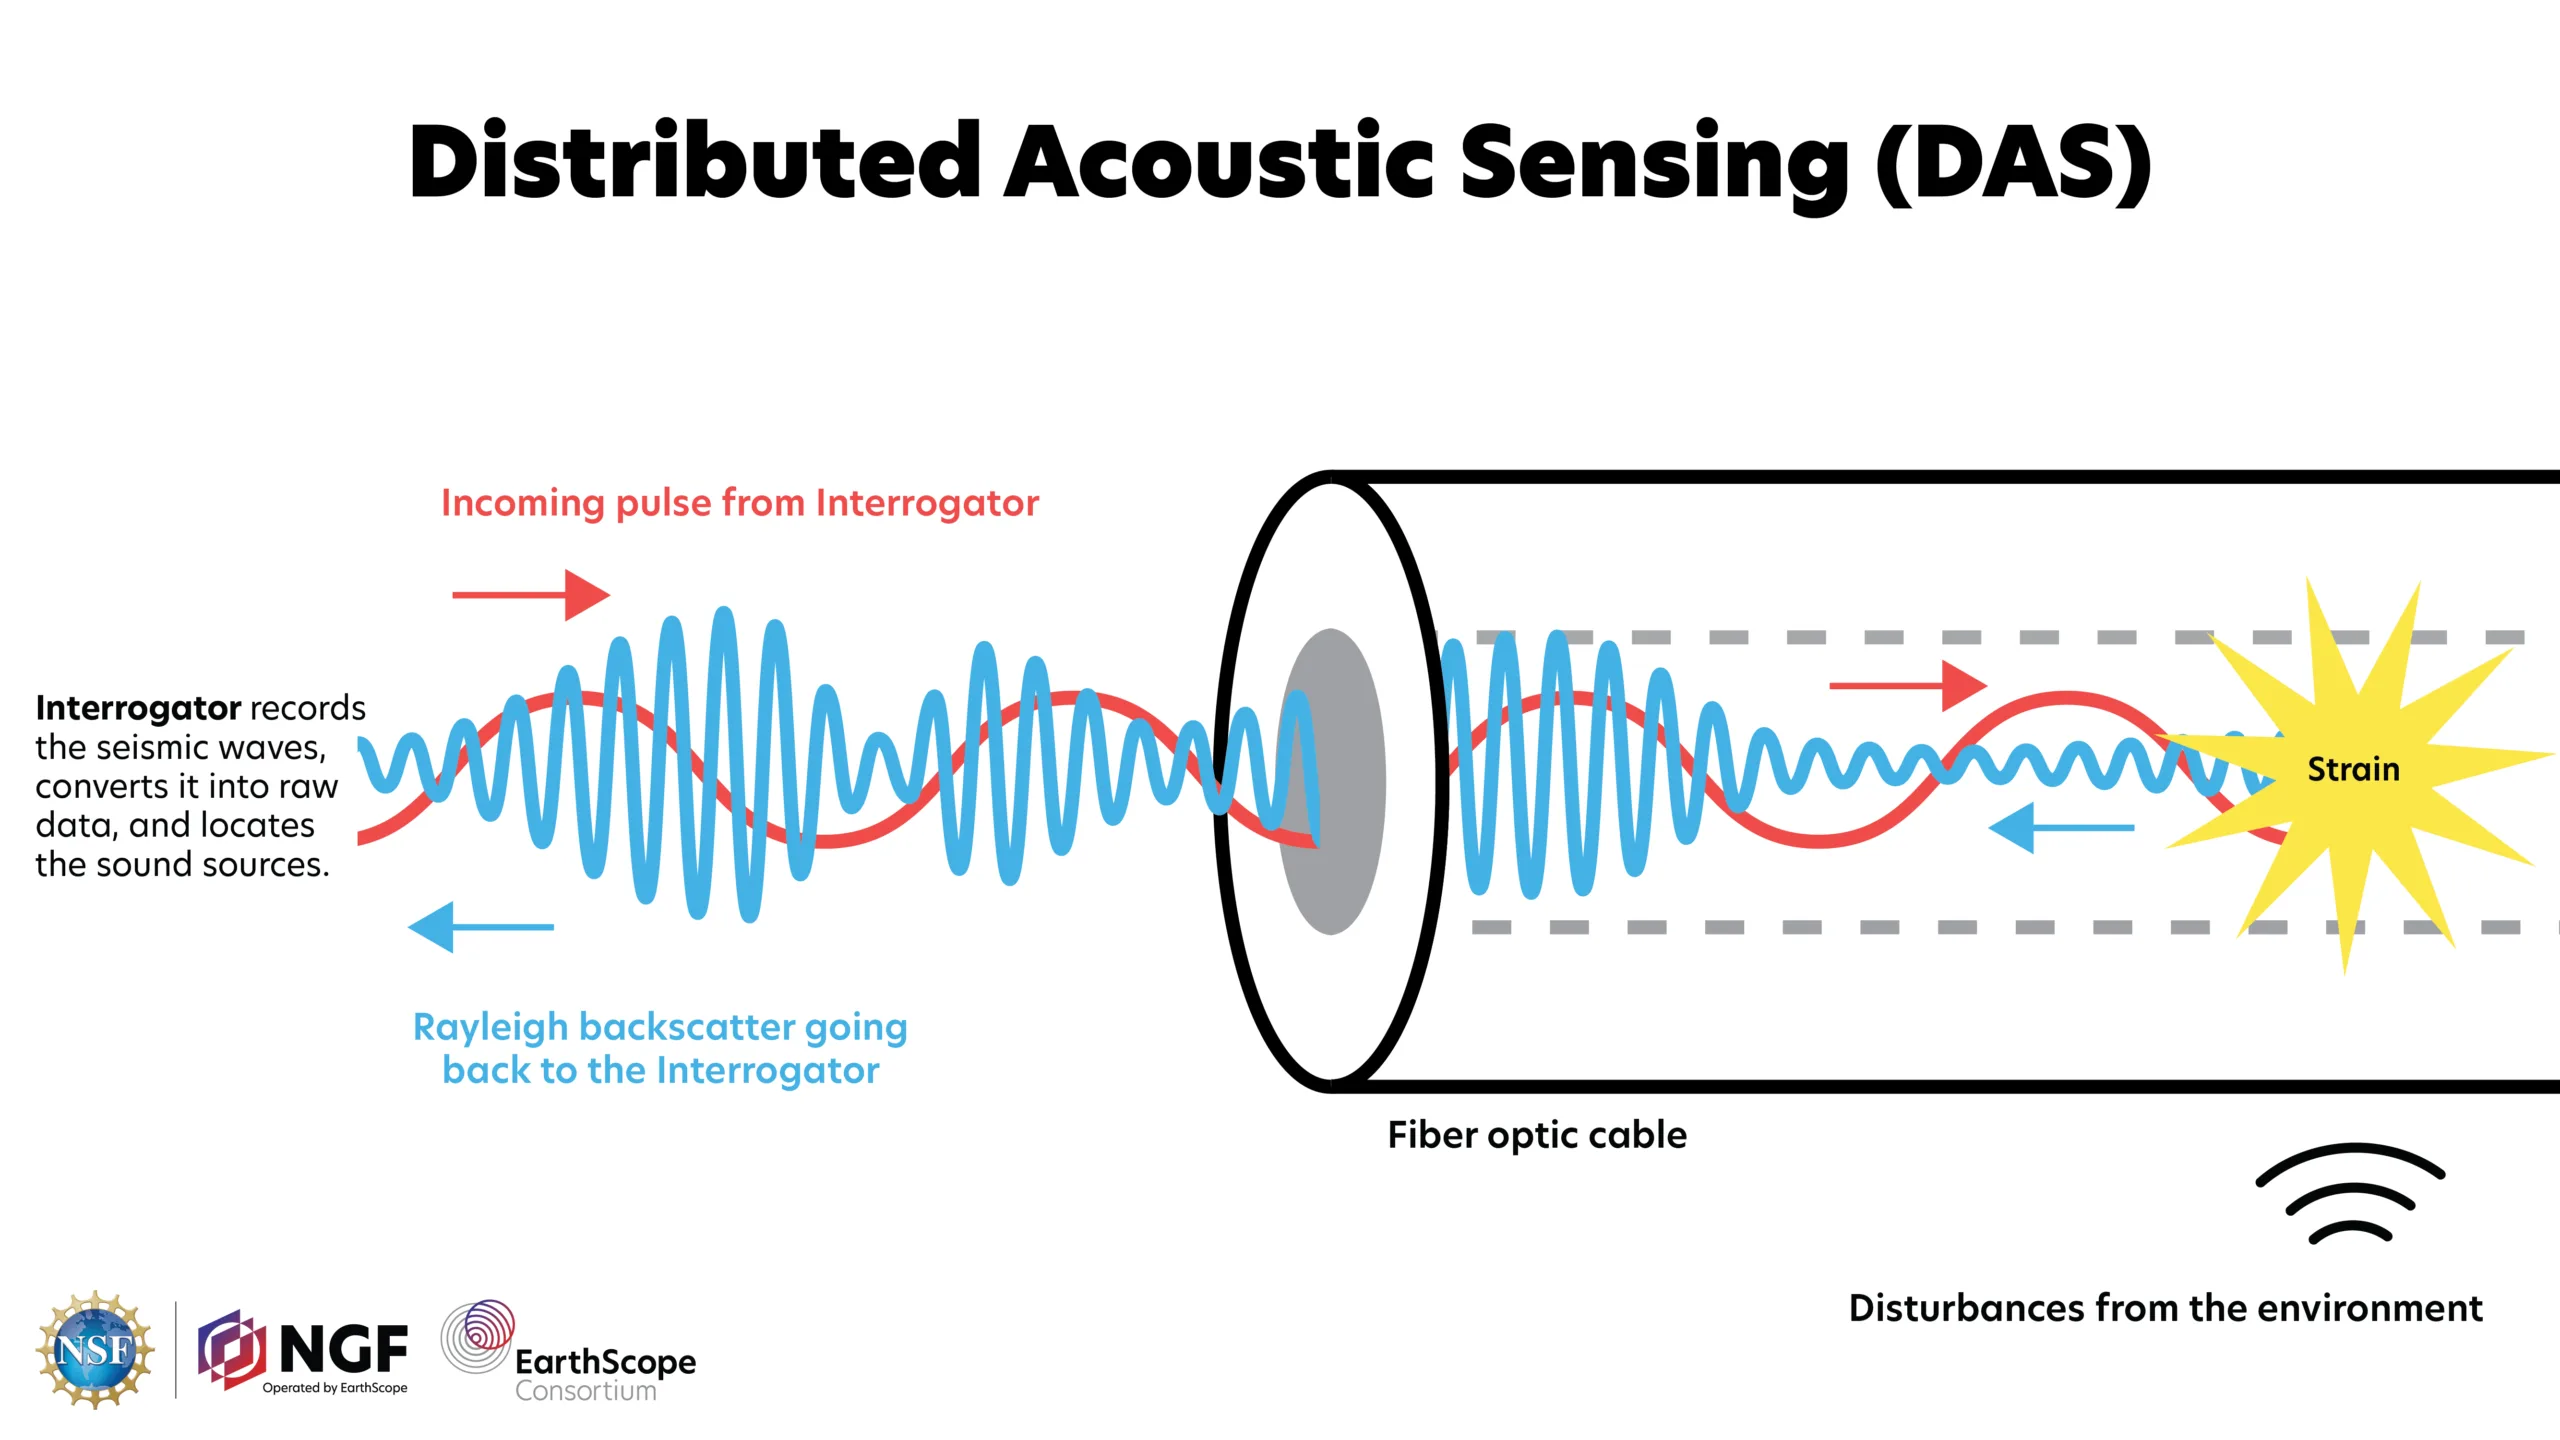
When the ground moves, the cable and its imperfections deform, changing the time it takes for the scattered light to return to the interrogator. In other words, DAS measures strain by continuously identifying changes in the light as it travels through the cable. In this way, scientists can identify passing seismic waves that jostle the cable.
But the interrogator doesn’t output the bounces from each individual imperfection. Instead, the operator sets the spacing for how the interrogator will divvy up the cable. For instance, in the current study, McLaughlin and colleagues set the spacing to 3.19 meters. The one-kilometer-long cable, then, functioned akin to a seismic network with more than 300 locations.
Study setup
Telecommunication cables traverse cities, span states, and connect continents. The cables on land (not the ones in the ocean) are not flopped atop the surface like giant snakes. Instead, they’re buried.
Working at the EarthScope Primary Instrument Center in Socorro, New Mexico, McLaughlin and his colleagues buried their DAS cable between two to eight centimeters below the sand and cobbles of the study area, ensuring that the cable crossed channels that become active during storms. Burying the cable reduced unwanted signals, like the whoosh of wind.
Occasionally, storms would scour the surface and expose the cable. “Every time we knew that it rained,” he said, “we’d look for sections where it was unburied and rebury it.” The cable was never exposed for longer than one to three days.
The cable encircles 4.5 hectares of desert, equivalent to about 8.5 NFL football fields. McLaughlin focused the analysis on three rills the cable crossed, although they’re not necessarily the only places where runoff was recorded. The first rill has a small drainage area of only about 0.3 hectares, whereas the other two are larger, with drainage areas of 1.9 hectares and 7.0 hectares, respectively. The last and largest rill also captures runoff from a gravel road that funnels water to the rill via a culvert.
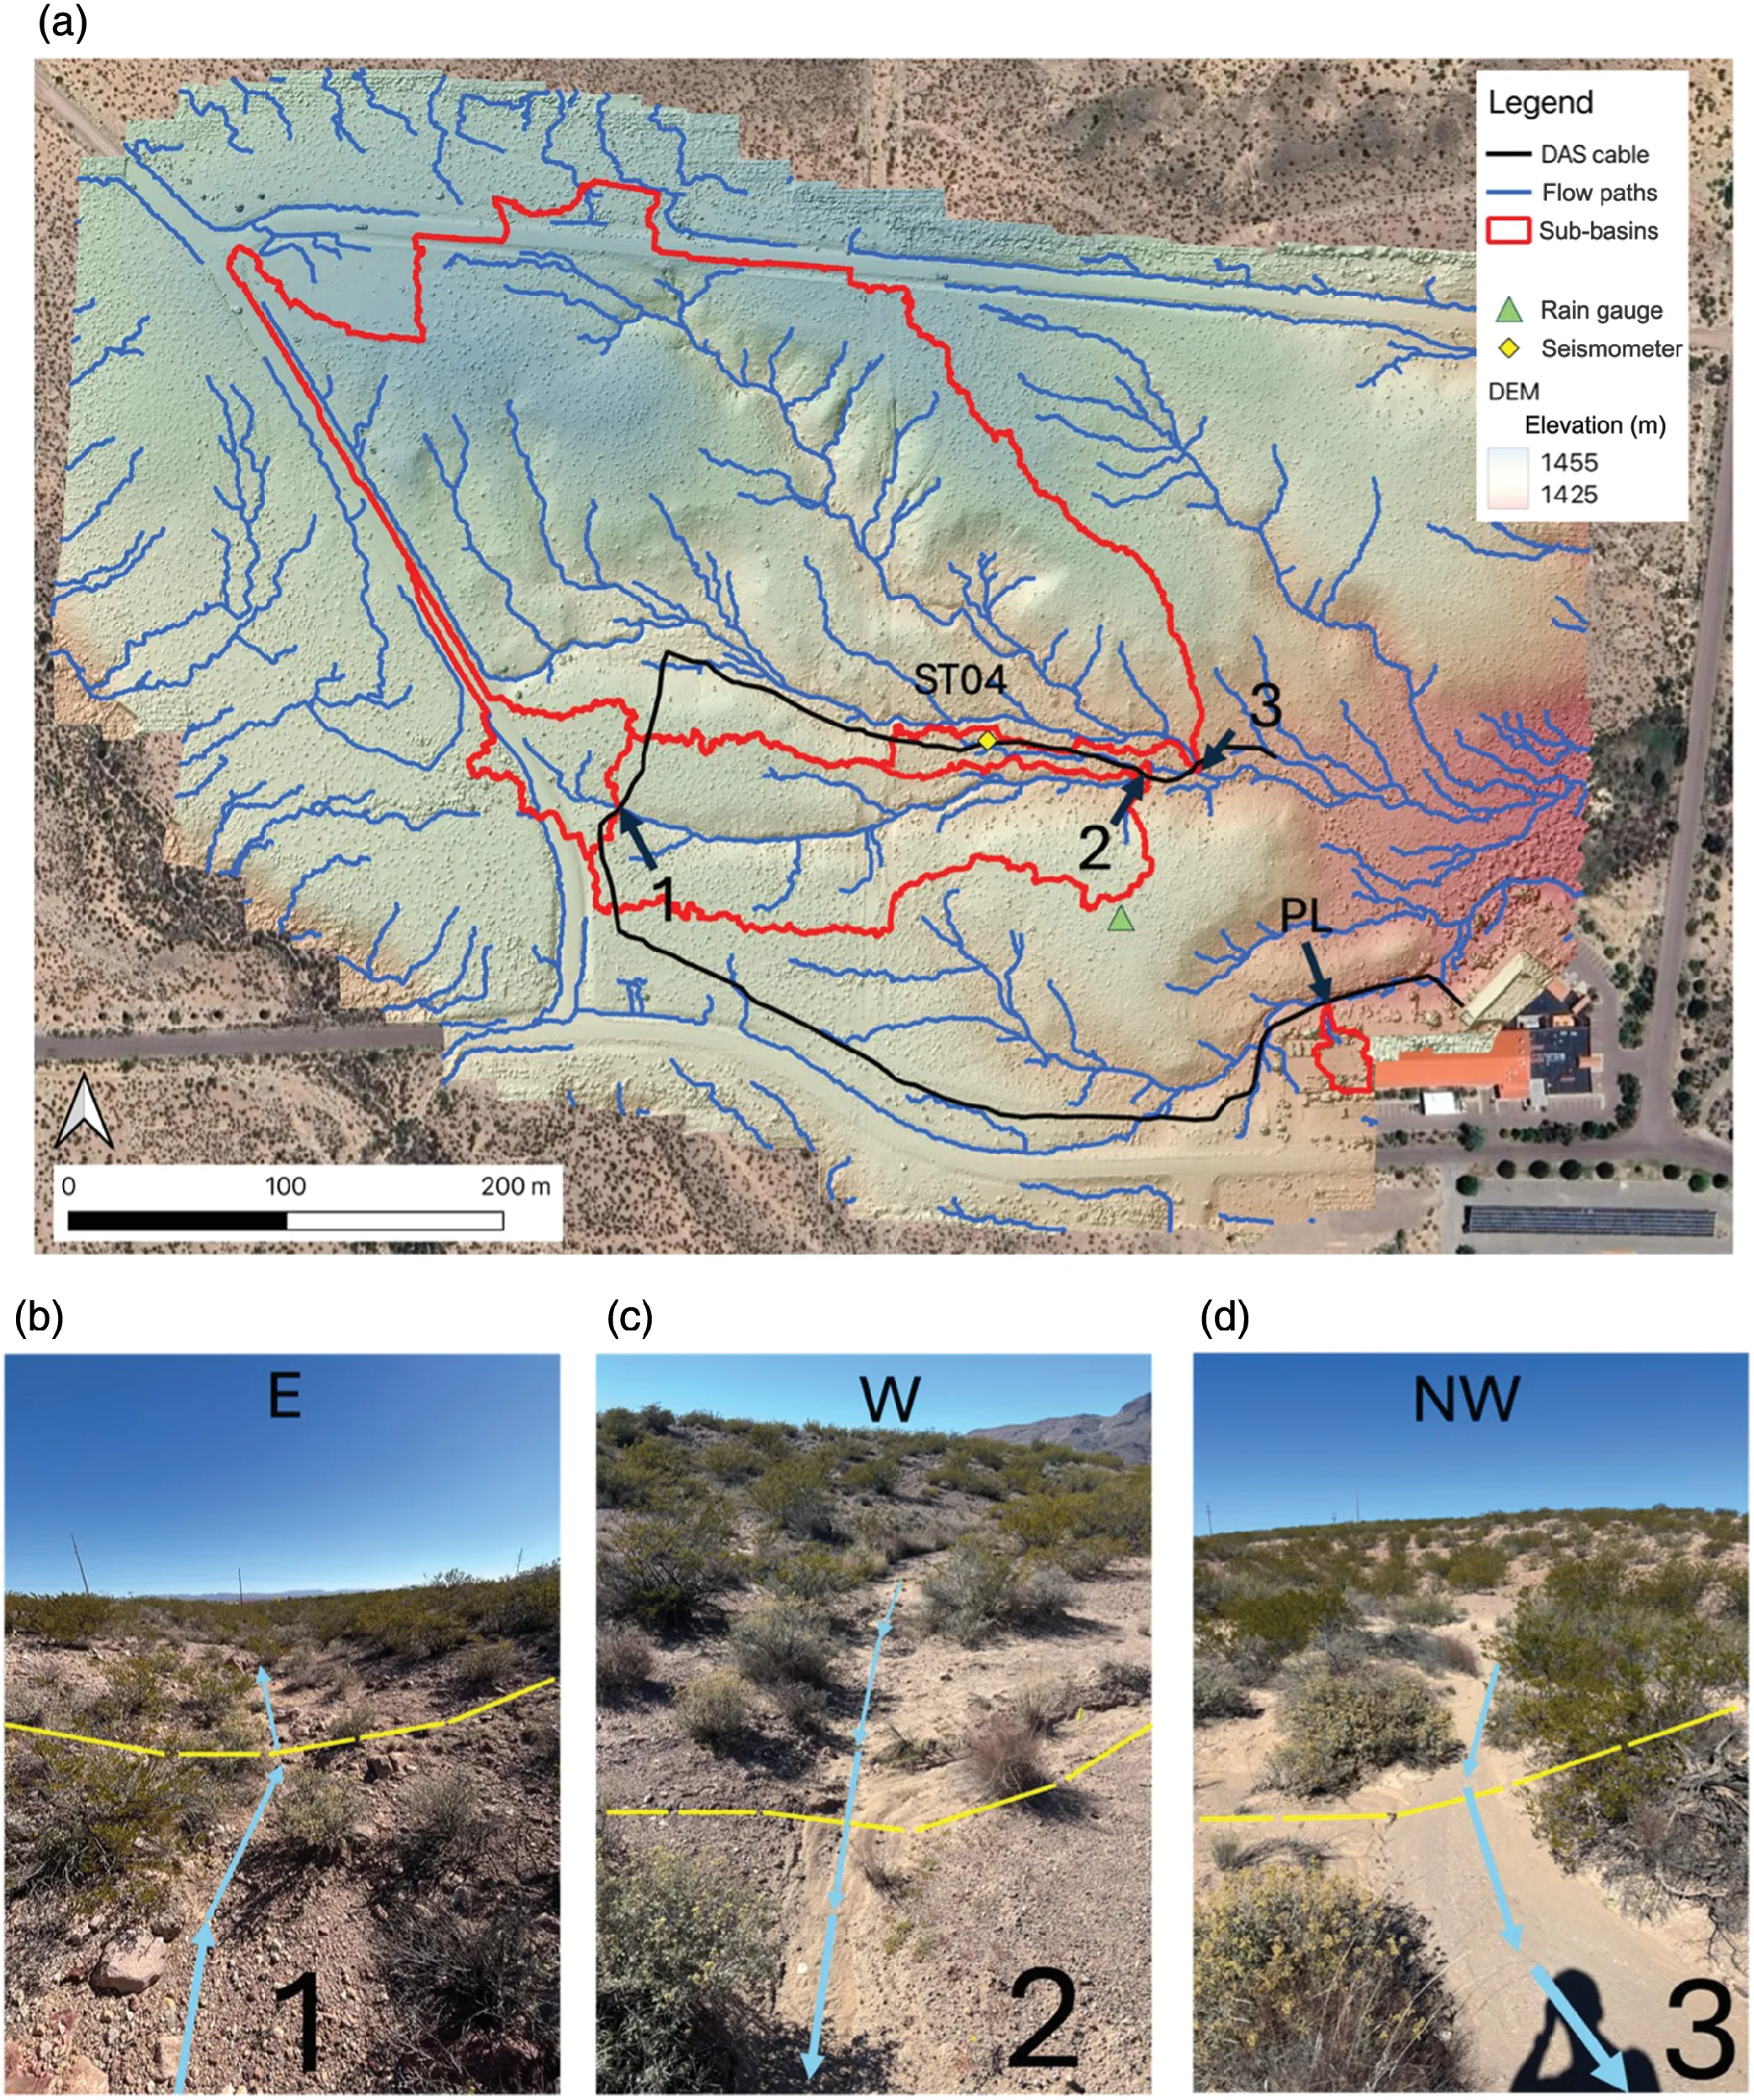
The experiment, which lasted from May to September of 2025 and fully encompassed monsoon season, captured four major rainfall events. Although there was some variation in onset of rainfall across the cable as the storms moved (on the order of tens of seconds), the team assumed rainfall intensity to be homogeneous across the relatively small deployment.
In the middle of the array, a tipping-bucket rain gauge measured rainfall intensity. This rain gauge is exactly what it sounds like. Rainfall funnels into a small bucket that, when full (0.53 millimeters of rainfall in this case), empties itself by tipping over. The rain gauge records the number of times the bucket tips per minute, which McLaughlin averaged over two-minute moving intervals to account for tips that span minutes. “You could be three quarters of the way to a tip at the end of one minute, and then the next minute, you have a tip,” he explained.
To determine the threshold for runoff generation, McLaughlin used a five-minute window. “The bigger the window,” he said, “the more confident you are in the true rainfall intensity.”
Rainfall versus rill-flow
For the DAS data, McLaughlin computed three kinds of spectrograms — times of quiet, times of rainfall, and times of rill-flow. Rill-flow is a prerequisite for runoff. “We had a lot of rainfall events,” said McLaughlin. Only four produced runoff.
All four major events featured rill-flow in the largest rill. The event with the most intense rainfall, which occurred on September 12, 2025, triggered rill-flow-related seismicity in all three rill-crossings. Although DAS captured the seismic signal of rain falling during these events, the rat-a-tat was swamped by the rill-flow after it began.
During rill-flow, rill crossings generated lower frequency signals in the DAS data, although each crossing had its own unique frequency distributions. Such varying signals were likely instigated by turbulence. However, McLaughlin occasionally observed signals as high as 200 Hertz during rill-flow, implying a secondary influence. He and his colleagues posit that grains entrained in the flow, bouncing along the stream channel, produced these higher frequency signals.
Another important finding: Rill-flow only appeared on the parts of the DAS cable within the rills — not the neighboring sections on higher ground.
The team also noted false positives for rill-flow in the DAS data. However, when they excluded any DAS-based detections outside a two-hour rainfall window, false positives dropped to zero.
Overall, the researchers observed that events with more than 0.5 millimeters per minute for at least 5 minutes showed seismic evidence of rill-flow. On the other hand, of the several events with maximum rainfall intensities between 0.4 to 0.5 millimeters per minute, none showedevidence of rill-flow. Together, these observations imply that rill-flow in this study area requires 0.5 or more millimeters of rain per minute for at least five minutes.
Interestingly, smaller rills required more intense rainfall to see rill-flow. For example, the smallest rill produced rill-flow only during the largest rainfall event, which exceeded 0.8 millimeters per minute for five minutes.
Future flooding
The threshold determined by McLaughlin and colleagues of 0.5 millimeters of rain per minute for five minutes or more is specific to the sub-basins in their study area. But this proof-of-concept study demonstrates how seismology can complement hydrologic and geomorphic research. At the time of publication, suitable fiber optic cables were less than $1 per meter, which is relatively cheap.
From a practical perspective, future deployments could tell us in real time when runoff begins or debris starts moving. Even today, “If you have a lot of these cables around and they happen to cross rills or larger channels,” said McLaughlin, “you can monitor them in real time.”
In the paper, the authors wrote that “runoff into rills following intense rainfall is one of the earliest phases of flash flooding.” Capturing when it starts could potentially provide hours of early warning for communities at risk of downstream flooding.
However, flash floods often begin in remote regions. DAS deployments would be more challenging, requiring weather-proof containment, portable, long-lasting power, and telemetry for real-time communication.
And it’s not just the DAS data. Rainfall data are required to eliminate false positives. In McLaughlin’s study, the tipping-bucket data for rainfall intensity were not communicated in real-time. However, real-time rain gauges exist, and satellite radar data showing precipitation locations are also near real-time data products.
Other complexities need to be unraveled as well. For instance, if it has rained recently, then a catchment may have less capacity available, which means flooding would be more likely. In the Grand Canyon, the affected region had experienced wildfires the previous year. Wildfires not only burn away vegetation that can slow water, but they also leave behind soil that repels water. The rain from intense storms had nowhere to go but overland.
“Surface processes are really important to study with [seismological] tools,” said McLaughlin, as he considered recent catastrophic floods like the Grand Canyon or the glacier collapse-related flooding in Nepal. “Leveraging seismic tools to study the surface is going to be more important in the future, and any type of tool that can do that is worth studying.”
This study utilized NSF NGF instrumentation and physical facilities, and the authors include EarthScope staff.