Geophysical imaging allows us to see below Earth’s surface, not unlike medical imaging that shows us what’s going on inside our bodies. Another similarity is that, like X-rays and CT scans and MRIs, we use several different geophysical technologies because each is sensitive to different things underground.
One of those techniques is magnetotelluric (MT) imaging. Using a combination of electrical field sensors and magnetic field sensors, magnetotellurics measure the conductivity (or resistivity) of the Earth. Earth’s magnetic field, interacting with the solar wind, thunderstorms, and other processes, induces electric currents in the Earth. The strength of this induced signal depends on the conductivity of the materials below the surface.
Different minerals and rock types vary in electrical conductivity, which means magnetotellurics can image the contrast where different rocks meet. Fluids (and the salinity of a fluid) also have a strong influence on conductivity, giving MT imaging a unique capability. And because magma is much more conductive than solid rock, it is also quite sensitive to the percentage of liquid vs. solid crystals in a magma body below a volcano.
Magnetotelluric measurements in one location are capable of identifying the depth of a feature because of another useful attribute of the induced current — electromagnetic energy at lower frequencies extends deeper into the Earth. So by measuring over a range of frequencies, we can measure conductivity from the surface downward.
MT science
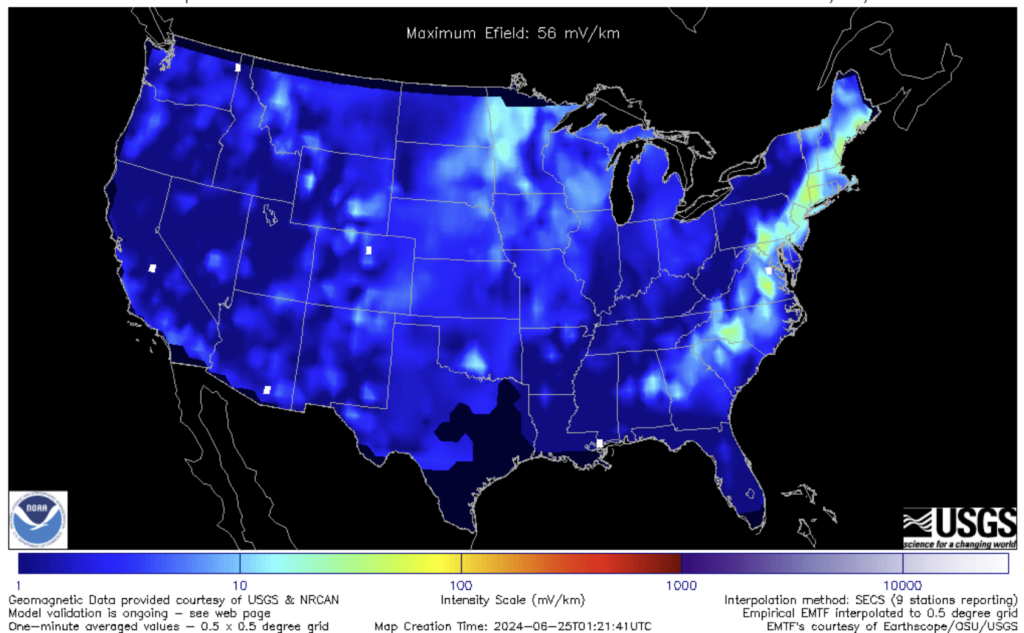
Magnetotelluric imaging efforts (like the MTArray) have yielded scientific insights of many kinds. For example, the MTArray survey of the contiguous United States gave us the ability to map electric grid susceptibility to damage due to space weather. The NOAA Space Weather Prediction Center produces a geoelectric field forecast based on this map, which utilities can use to directly model the impact of space weather events on local infrastructure.
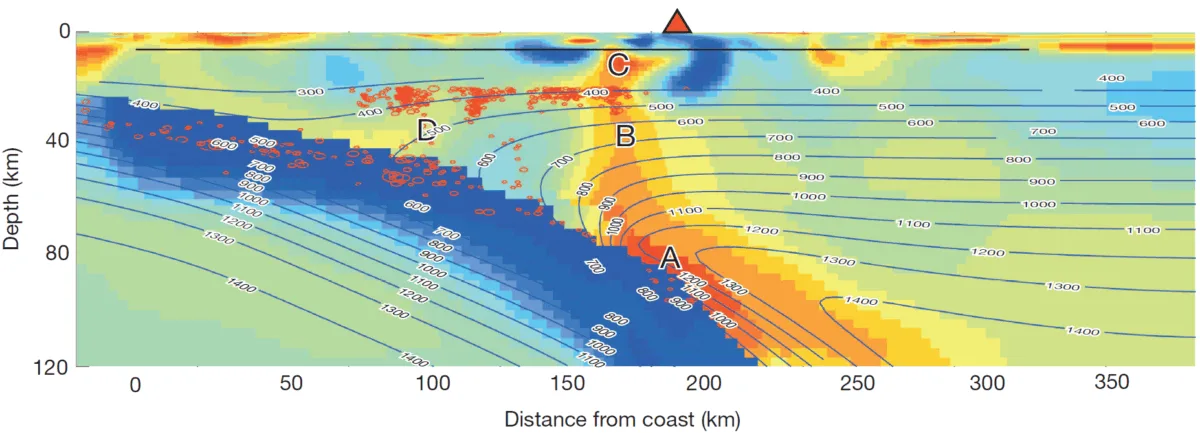
MT’s ability to detect fluids is incredibly useful in subduction zones, where fluid driven from a subducting plate causes melt in the hot, dry asthenosphere above, eventually feeding volcanoes. A 2014 study mapped the region beneath Washington’s Mt. Rainier this way, clearly imaging the zone where this process produces magma that rises toward the surface.
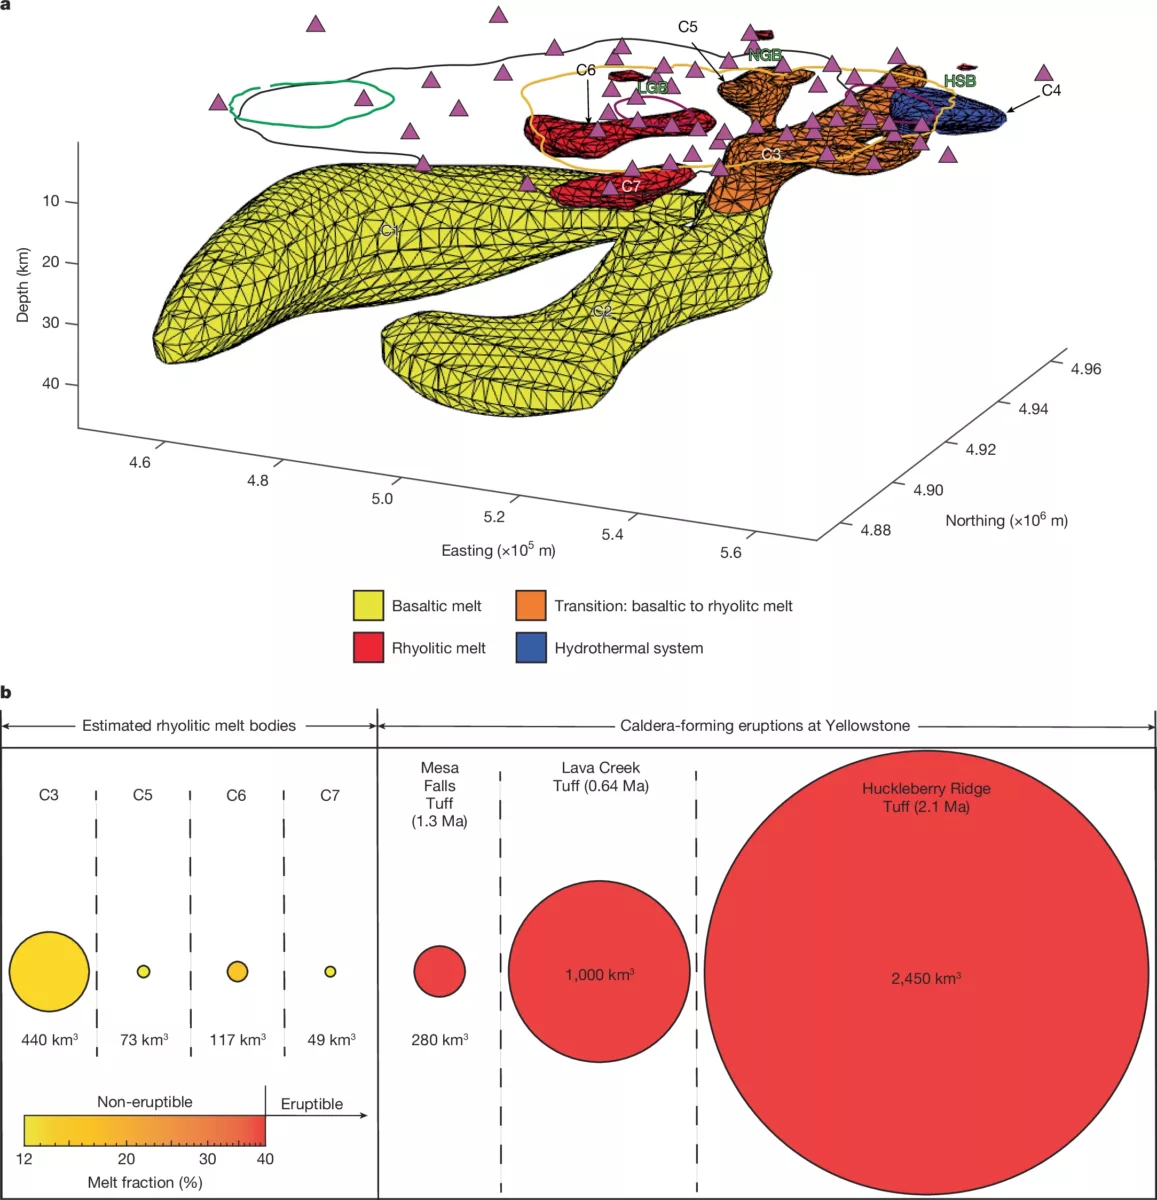
MT has also been used to image the magma system beneath Yellowstone. In combination with seismic imaging, this has allowed researchers to estimate the proportion of melt vs. solid crystals and understand that these reservoirs currently too little melt to be eruptible.
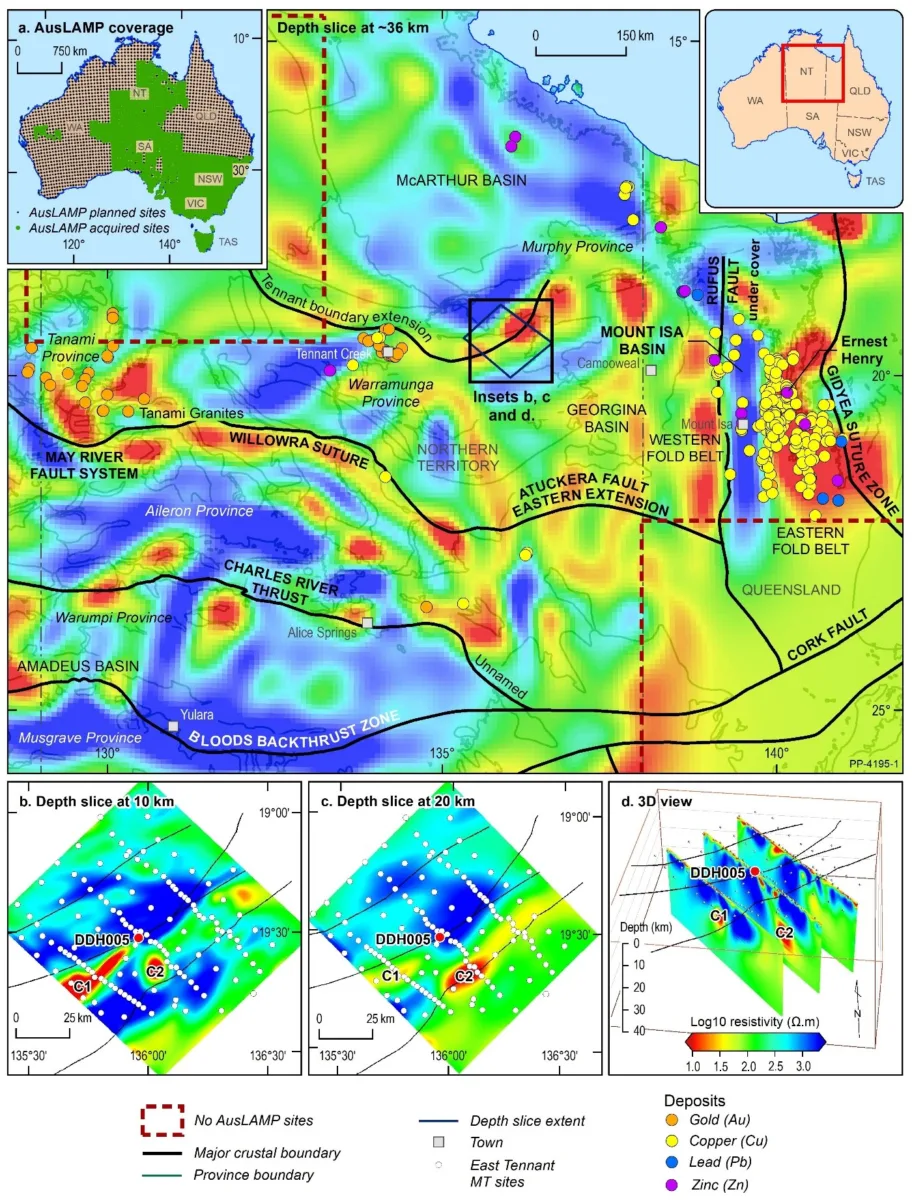
At regional to continental scales, MT imaging can reveal broad geologic structures. This helps us understand the history of a continent — how it was assembled by tectonic events over time. That big-picture context can allow you to identify areas where certain types of mineral deposits are likely to be found, based on the geologic processes that concentrate that mineral. The AusLAMP project has undertaken a systematic MT survey of Australia partly for this reason.
For example, nickel sulfide deposits could be found where a combination of factors line up. A specific type of magma provides the ultimate source, but it needs a pathway through the thick continental plate like the boundaries between the tectonic pieces of Australia that have been assembled together over time. Then, fluid flow pathways like fault systems might hold hydrothermal waters that carry nickel sulfide and concentrate it in ore deposits.