On June 10, the MTArray completed its last deployment, successfully filling in the last blank spot in the contiguous US after 18 years. This project revealed the structure and composition of the continent with an entirely new kind of window into the subsurface—and it almost didn’t happen.
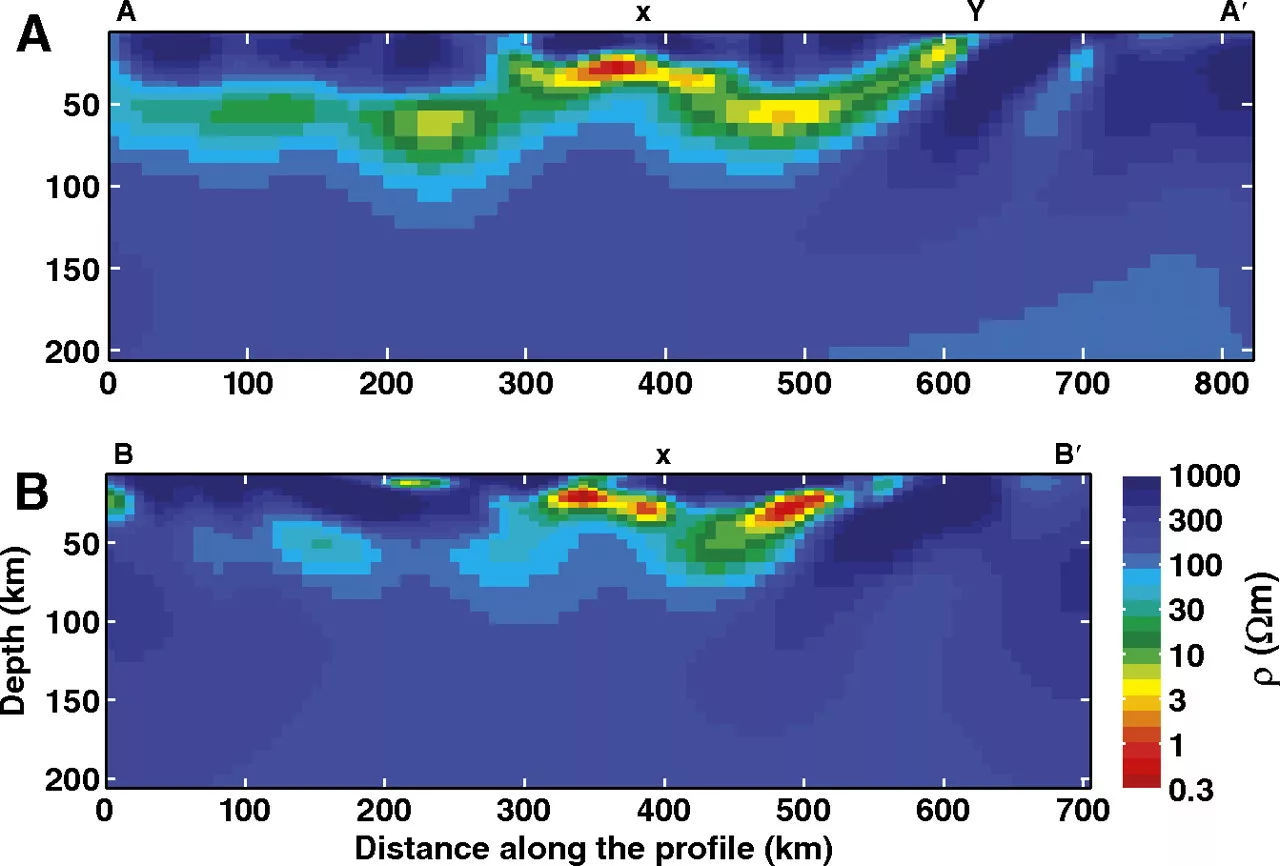
Magnetotelluric (or MT) instruments measure electromagnetic energy below the ground surface. Rather than measuring a response to an artificial signal, these simply listen in on the natural electric and magnetic fields induced by incoming electromagnetic waves from the Sun at different wavelengths. By deploying sensors in a grid over some area, the result is a measurement of the Earth’s electrical conductivity in three dimensions. This is related to physical properties like the type of sediment or rock, and the characteristics of fluids that may be present. That means that patterns of conductivity below the Earth’s surface can reveal the geology, a bit like the way medical imaging can reveal anatomy.
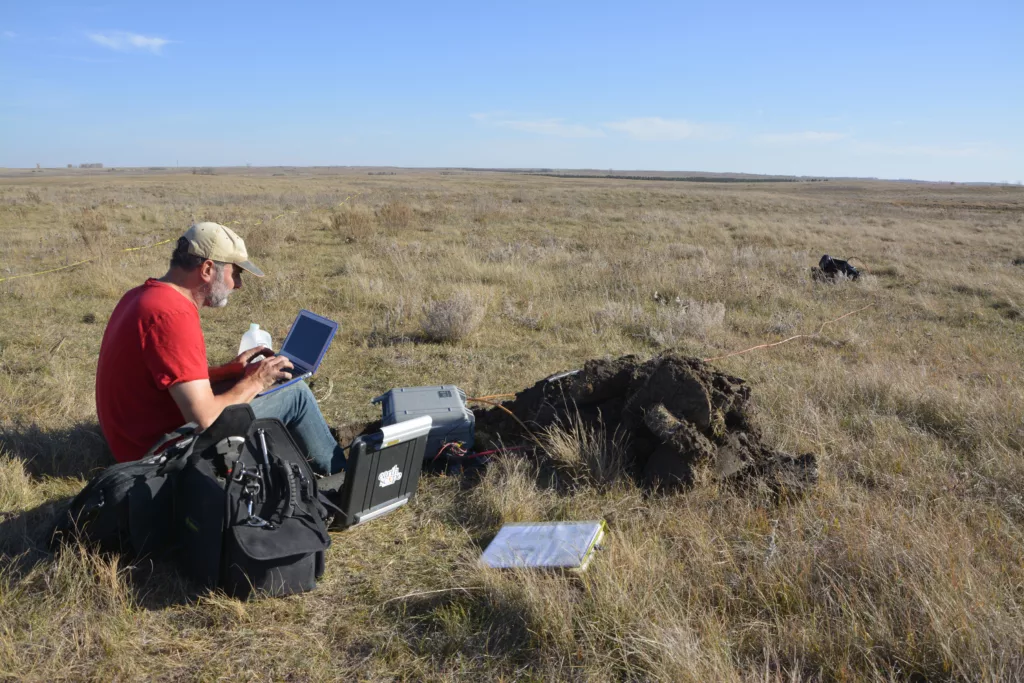
As part of the original EarthScope program that saw the creation of the geodetic Plate Boundary Observatory (now Network of the Americas) and the seismic USArray, a set of magnetotelluric instruments was deployed in patches of evenly spaced (every 70 km) instruments to eventually cover the contiguous US. This Magnetotelluric Array project began with more modest ambitions in 2006, deploying along coastal Oregon and Washington. But after the initial results proved exciting, it grew into a large-scale effort led by the National Geoelectromagnetic Facility at Oregon State University that—as of this summer—has painted a magnetotelluric picture of the US from the West Coast to the East Coast.
Map animation: Adam Schultz, Oregon State University
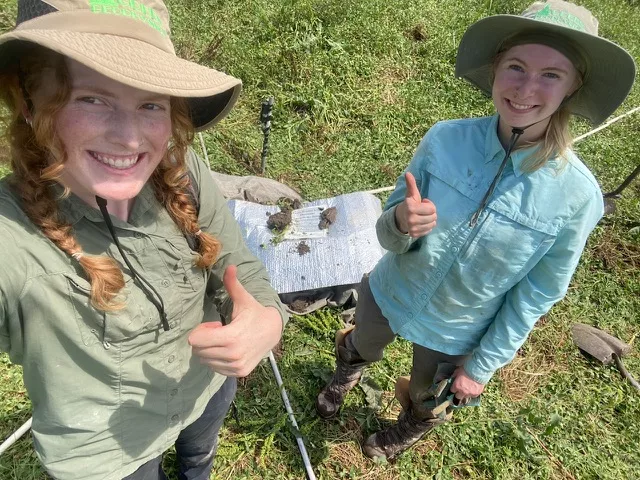
Currently, the NSF SAGE Facility operated by EarthScope manages a pool of over 30 MT instruments able to support MT surveys across the world, at the scale of the crust and upper mantle to shallow features within a volcano or fault system.
A magnetotelluric milestone
A celebration at the 2023 AGU conference in San Francisco brought many members of the project together to look back at what it took to reach this point. What started as an NSF-funded project eventually attracted the support of multiple federal agencies. That was largely due to the realization that mapping conductivity across the country would contribute directly to addressing space weather hazards—a priority receiving attention during the Obama Administration.
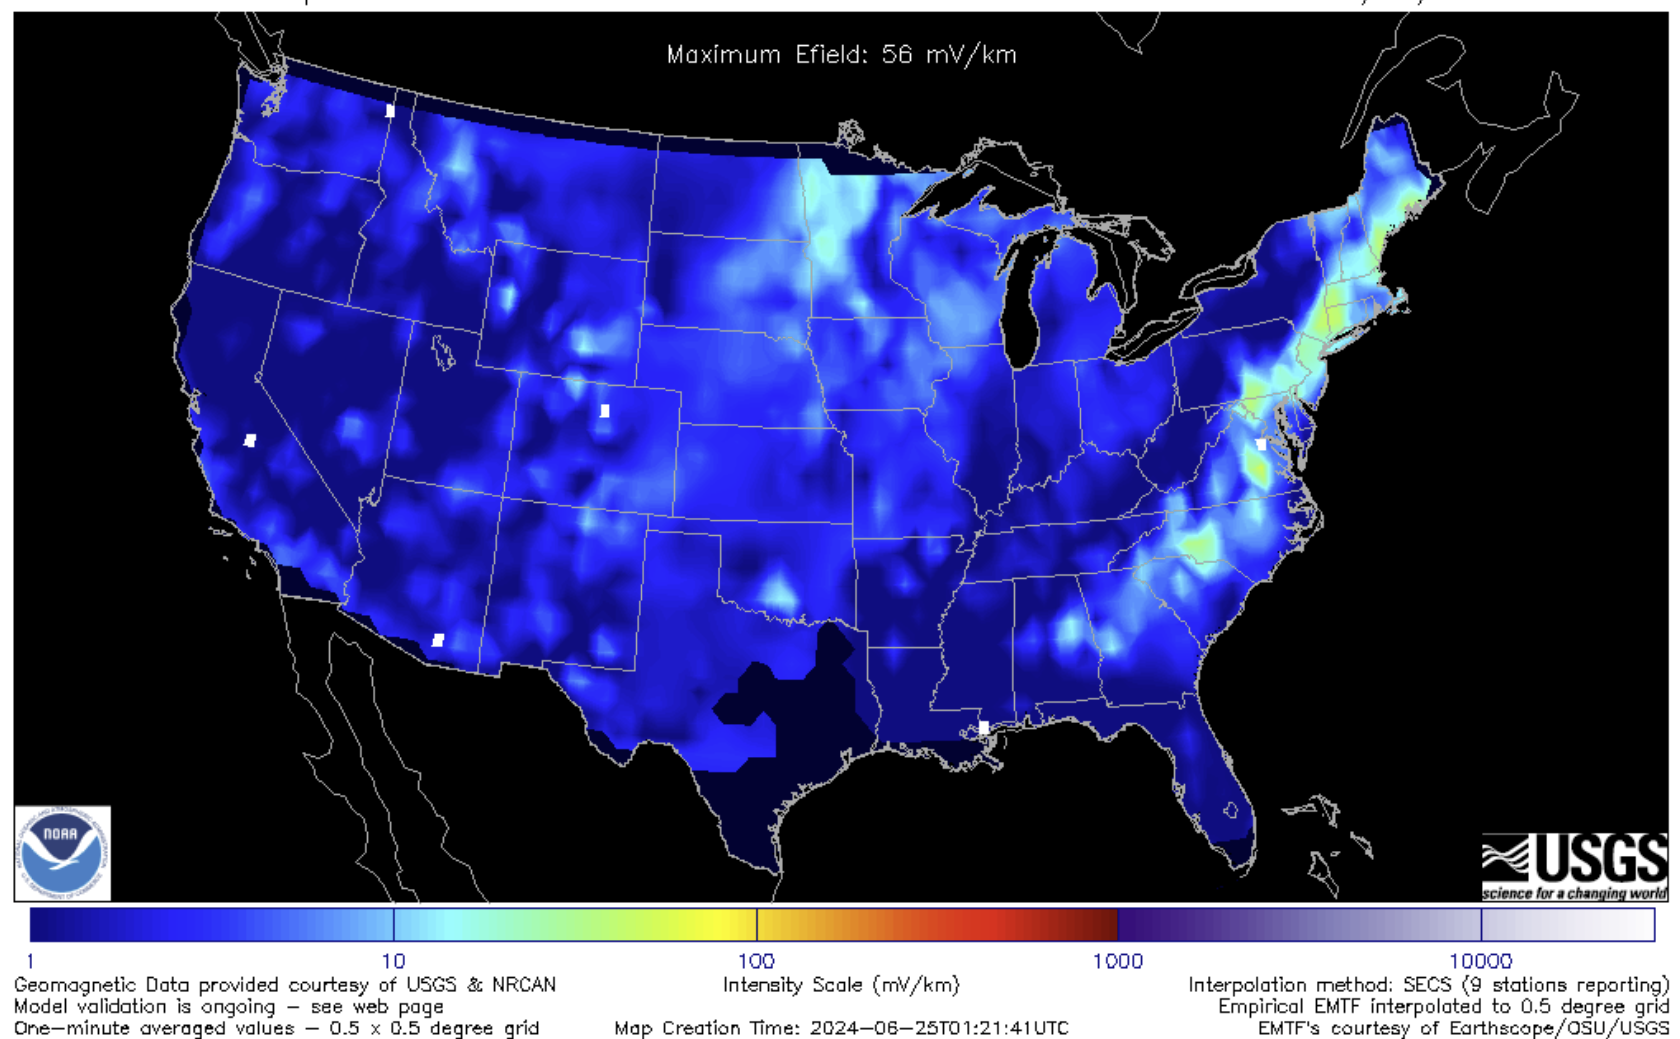
Severe space weather events can damage electrical infrastructure, but this risk isn’t the same everywhere. In areas where the conductivity of the Earth is low—if rocks are more resistive to currents—then current propagates through human infrastructure like pipelines and powerlines, stressing entire electric grids. In order for utility operators to understand how to mitigate this risk, they needed to know how conductivity varies in their region. A magnetotelluric survey could immediately be applied to this practical problem.
Currently, in addition to monitoring solar activity and forecasting the resultant space weather, the NOAA Space Weather Prediction Center produces a geoelectric field forecast based on this dataset. Utilities, in turn, use this to directly model the impact on components of their local grid.
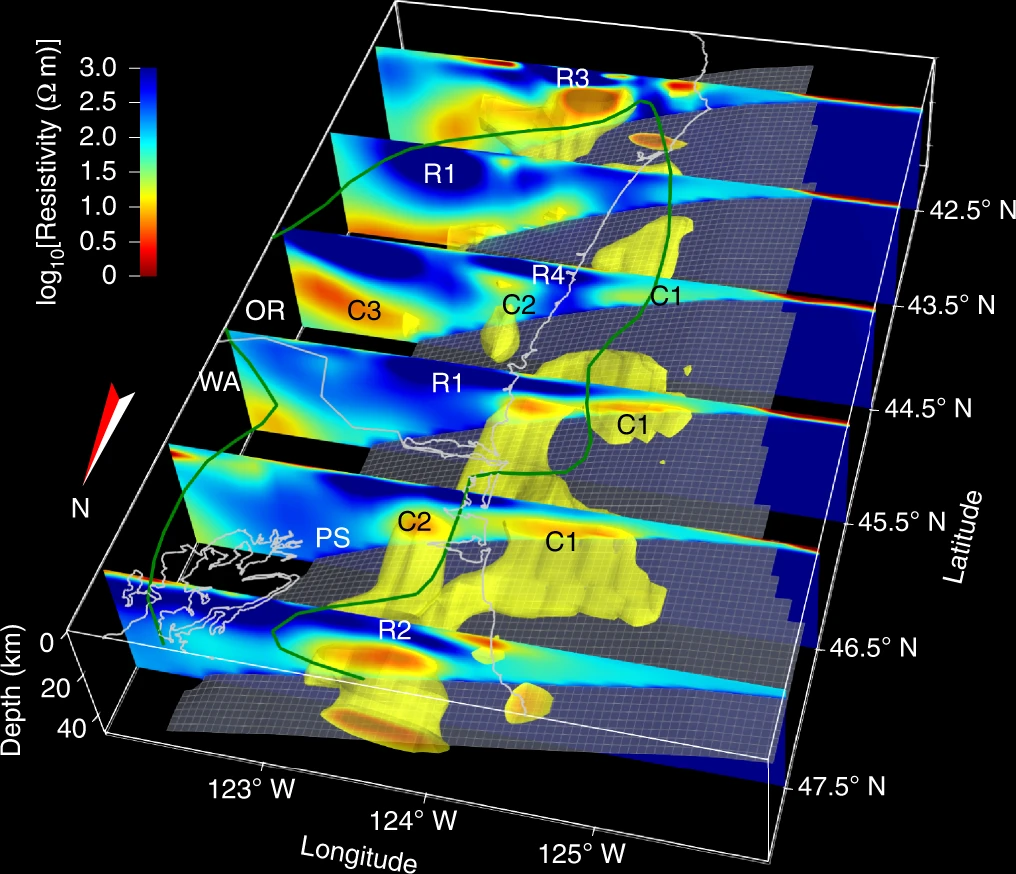
In addition to revealing a grid hazard, the MTArray has revealed deeper geologic structure and activity all around the US. The initial mapping in the Pacific Northwest showed that MT complemented seismic imaging well, uniquely highlighting different properties within the subduction zone. The sensitivity to fluids allowed us to see the presence of water carried downward by the subducting plate, where it causes hot, dry mantle to melt, feeding the volcanoes above. Variations in water content and rock type along the interface between the plates also provided insight into the distinctive “episodic tremor and slip” phenomenon that occurs there.
Elsewhere, MTArray mapping around Yellowstone imaged the presence of magma beneath the region. Combined with seismic imaging, these data painted a clearer picture of the partial melt system feeding upwards through the crust.
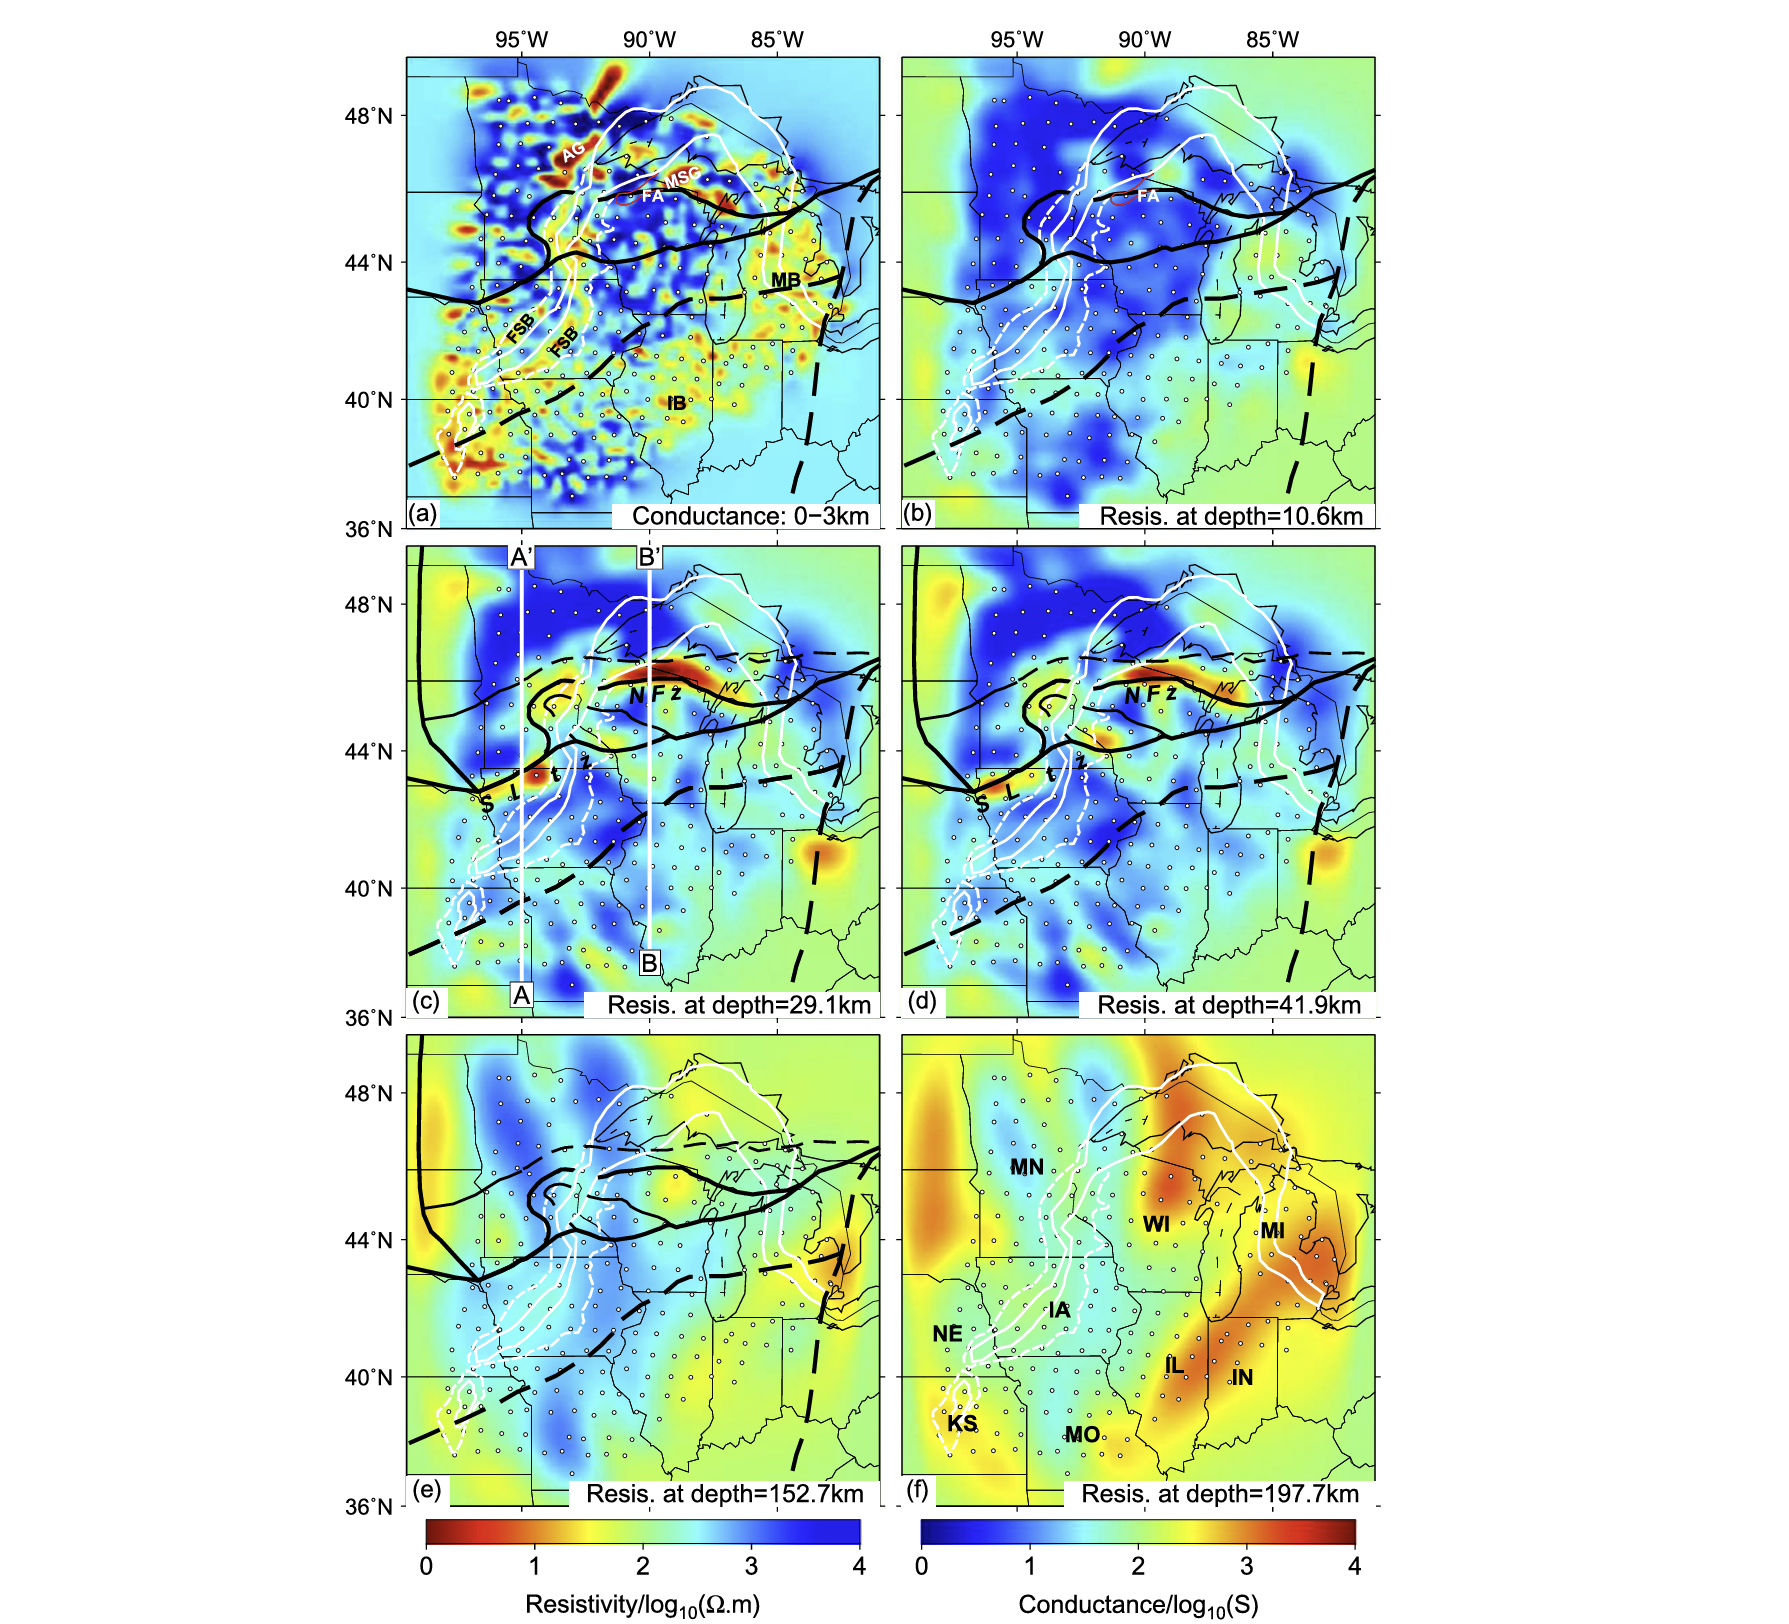
Studying geologic structure is all about reconstructing history to understand the things beneath us in the present, and the MTArray was also able to do this in geologically quieter regions. For example, it imaged deep scars like the Mid-Continent Rift—a 1.1-billion-year-old failed rift that stretches from Michigan and Lake Superior down to Oklahoma.
These are just a few examples, and science is continuing to be produced from the MTArray dataset. Even crossing the finish line of the mission to map out the entire contiguous US simply marks the completion of a foundation. Building on this big-picture context, studies have already begun to zoom in on smaller-scale details. With a new way to peer into the Earth, it’s no surprise that fascinating results surfaced worthy of closer inspection. Who knows, perhaps they’ll even spark the next new geophysical technique to reveal the inner workings of our planet.
This project was completed by the National Geoelectromagnetic Facility at Oregon State University and its subcontractors (GSY, University Utah, Zonge International, Green Geophysics) with funding support from the U.S. National Science Foundation (2006-2018 EarthScope program), NASA (2018-2020), and USGS (2020-2024 through a cooperative agreement with OSU), and a partnership with EarthScope Consortium (formerly IRIS).


