Starting in May of 2018, the Puna District of Hawai’i began to experience back to back eruptions of their Kīlauea volcano, along with earthquakes. For five months, the United States Geological Survey (USGS) Volcano Alert Level for the area was raised to WARNING as 13.7 square miles of land became covered with one billion cubic yards of lava from Kīlauea. Luckily, being the most impactful eruption of Kīlauea and having taken place in modern times, the documentation was extremely detailed and insightful. In a research paper published in the Annual Review of Earth and Planetary Sciences, Anderson and his colleagues lay out a helpful timeline of the initial eruption and following events, as well as addressing the applications for the future from the collected data.
The timeline
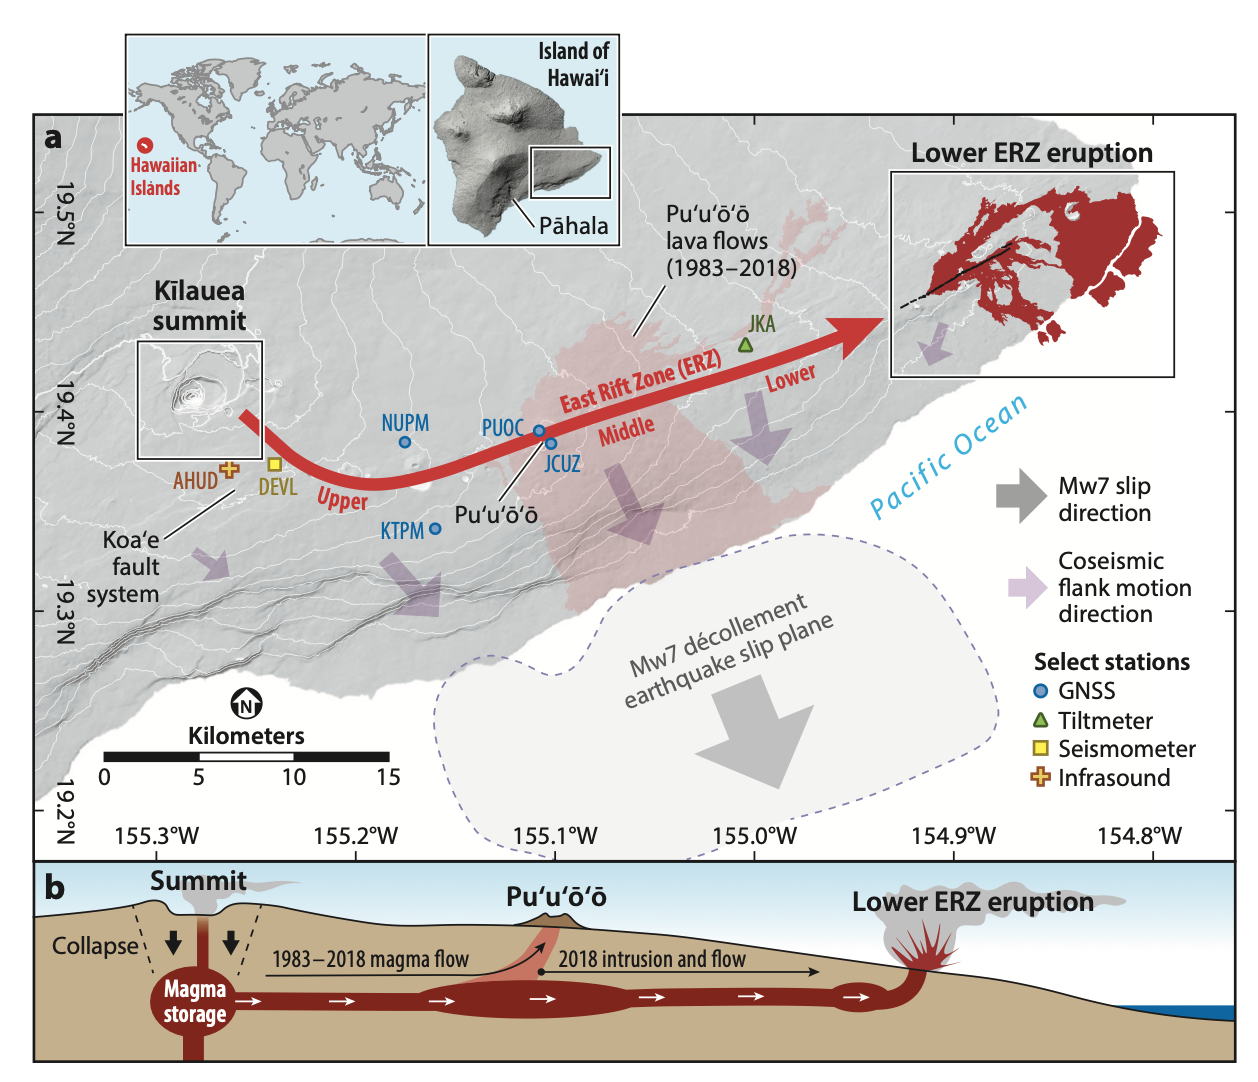
Kīlauea is an over 200,000 year old shield volcano—named after the image of a shield lying on the ground for how low to the ground it is in profile—and is on the southeastern shore of Hawai’i Island. It has two main rift zones, one stretching to the east called the Eastern Rift Zone and one stretching to the southwest called the Southwest Rift Zone (SWRZ). The ERZ is more active, and the last eruption from it before 2018 was in 1960.

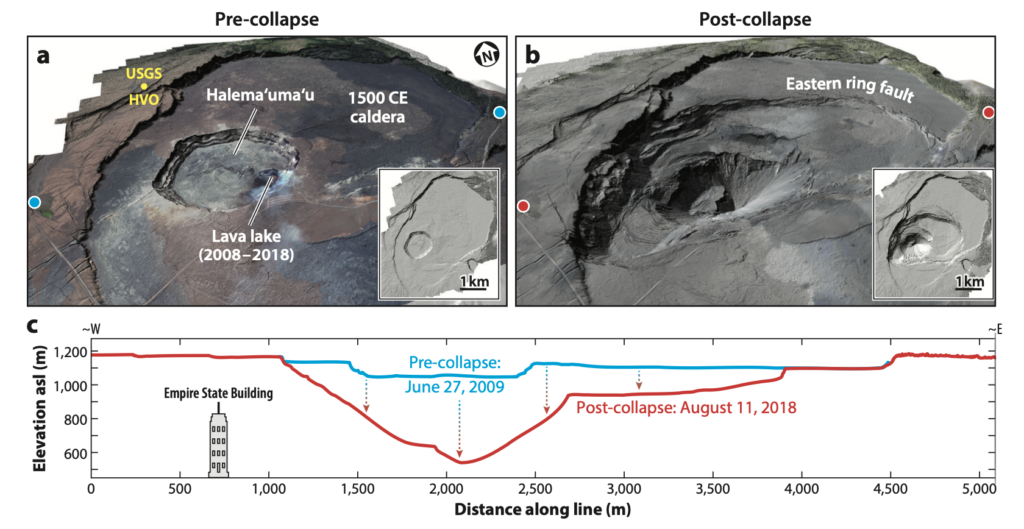
In the ERZ is the volcanic cone Pu‘u‘ō‘ō. On April 30, 2018, its crater floor collapsed following weeks of pressure increases, beginning a flow of magma into the Lower ERZ (LERZ). For the next two weeks, Kīlauea was in what the research group led by Anderson calls Stage 1. During this, creation and enlargement of intrusions and fissures caused new drainage from the lava lake, and earthquakes began, with hundreds of small earthquakes detected over the next few days due to magma migration. The end of Stage 1 is marked by the caldera collapse and an increase in flows and drainage of magma. This led into Stage 3, where the drainage caused the collapse to grow, followed by more eruptions. The end of the collapses and greatest effusion of lava was marked by Stage 4, until September 5 when the Volcano Alert Level went back to NORMAL.

Monitoring the event
Kīlauea has been the most active of the volcanoes on the island in recent history, so why wasn’t anyone able to properly predict the magnitude of the eruptions and collapse? Anderson’s paper states that few conceptual models that have been used to predict hazards existed to relate this to the collapsing that was ongoing. The collapses were abrupt and the caldera kept growing. With only a few instances of caldera collapse having been observed in the past, the observations are limited and poorly understood. So when the collapse cycles stopped despite being relatively repetitive and therefore considered stable—suggesting there could have been more collapses—it puzzled researchers more.
Because this took place in 2018, researchers were able to closely monitor and document the eruption using remote-sensing, field investigations and sampling, aircraft systems, and in situ monitoring networks. Post-collapse information provided a lot of insight into what happened and how to adjust models to fit with future hazards. Anderson states that “Kīlauea’s 2018 eruption continued for months in what may have been a delicate balance between withdrawal-induced reservoir depressurization and collapse-induced repressurization. This process resulted in erupted volumes an order of magnitude larger than those observed historically from vents at comparable elevations that did not trigger summit collapse.”

Now, entirely new information has been revealed about the volcano itself due to the drainage and collapse. The geometry and volume of the magma systems involved in the eruption can now be studied, and the evolution of shield volcanoes like Kīlauea can be further understood, and patterns can be recognized and noted. The eruptions has also left researchers with new questions, allowing new avenues for future work. The USGS has been motivated to improve their capacity of response and communications for volcanic eruptions, and a new National Science Foundation (NSF) funded initiative called CONVERSE is facilitating better coordination of data efforts and return during eruptions. The documentation and communication around eruptions like Kīlauea has and will continue to improve our models for future volcanic eruptions.
Modeling the caldera
For example, another research paper by Anderson and Krozier was able to take the information learned from the 2018 Kīlauea eruptions and subsequent collapse and expand on it. They were able to identify that the pattern of the caldera collapse resembled tectonic earthquake cycles, offering a new avenue to look at the collapses. They also introduce a new model to account for the magma and rock interactions and certain geometries—referred to as “a two-dimensional axisymmetric mafic piston-like collapse earthquake cycle model.” The basic idea is to conceptualize the collapse process as a downward movement, similar to how a piston moves. So, this model represents the collapse of volcanic calderas with special emphasis on the environment, symmetry, and motion of the events caused by earthquakes.
The paper also shows that the time intervals between collapse earthquakes and their magnitudes depend heavily on various other factors that weren’t considered before—inertia, changing stress patterns, and fault geometry, to name a few. They also are able to find that ring faults (a series of overlapping normal faults forming a circle-shaped outline) can stabilize fairly quickly and become almost vertical, which helps explain why Kīlauea abruptly stopped in August of 2018. In this paper, they use the months-long eruptions and earthquakes from Kīlauea as their case study to validate their model.
We can already see the effects of the documentation and observations of the 2018 Kīlauea being put to good use. This is just one study using the data from 2018 to develop a new model that can help us better understand the mechanics behind caldera collapses caused by volcanic eruptions. We can only expect that as more information comes to light and more data is documented and studied, clearer pictures and better models of volcanic events will be created.
Intro image credit: USGS Public Domain

