

Earth’s climate is warming. One of the most obvious tell tale signs is the decline of the world’s glaciers, observed through their increased melting and subsequent retreat. Greenland, the northern hemisphere’s polar ice sheet, is a major source of freshwater input to the oceans and will cause sea levels to rise dramatically over the century. As the full effects of a warming Earth begin to materialize, researchers are eager to quantify exactly how much of Greenland could melt—and how fast. The Helheim Glacier could help them answer this question.
Glacier monitoring allows us to understand the conditions that sustain them—or drive their collapse. Most monitoring uses remote sensing satellites in low Earth orbit, which gives us reliable temporal and spatial resolution of ice fields, sheets, and glacial valleys through the season. There’s just one problem. Lots of glacier activity happens much faster than the time it takes for these satellites to complete orbits. That means we are missing out on key information about how glaciers behave in warming conditions. This means that any sudden events that trigger changes to the ice are often not measured as they happen.
That’s where geodetic techniques, such as terrestrial radar interferometry (TRI), can help fill the gap. Like Interferometric Synthetic Aperture Radar, or InSAR, TRI uses radio waves to scope out objects on a surface and take detailed measurements of change over time by differencing scans. Unlike InSAR on satellites or aerial craft, TRI is deployed on the ground where it can make high resolution scans of a changing surface, like ice.
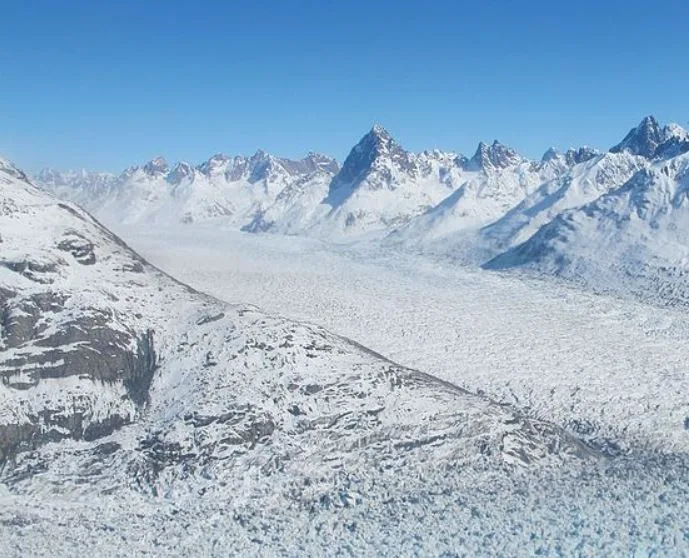
A new study published in Geophysical Research Letters used portable differential TRI devices to gain major insights into the day to day movements of the fast-moving Helheim Glacier, a key source of freshwater flux into the oceans.
Researchers wanted to capture a seemingly periodic calving process occurring every few days in summer at the terminus of the glacier, but needed an instrument capable of taking measurements over minutes to hours instead of days to weeks. To do this, they set up a portable TRI device on Helheim Glacier to take careful scans with a sub-meter resolution of the ice front to measure vertical glacier movement and speed caused by ocean tides.
When high tide occurred, researchers hypothesized that water could intrude underneath the ice front and basal layer of the glacier, where the ice and rock meet. This injection could cause the glacier to rise up to accommodate the water pressure. Because Helheim is a large glacier, any tidal effect on the vertical displacement of the ice would be difficult to pick up with the temporal and spatial resolution of an orbiter, making TRI the best tool for the job.
Over the course of six days in August 2014, researchers took measurements every 16 minutes and differenced every 6 hours to capture this tidal intrusions’ effect on glacier movement.
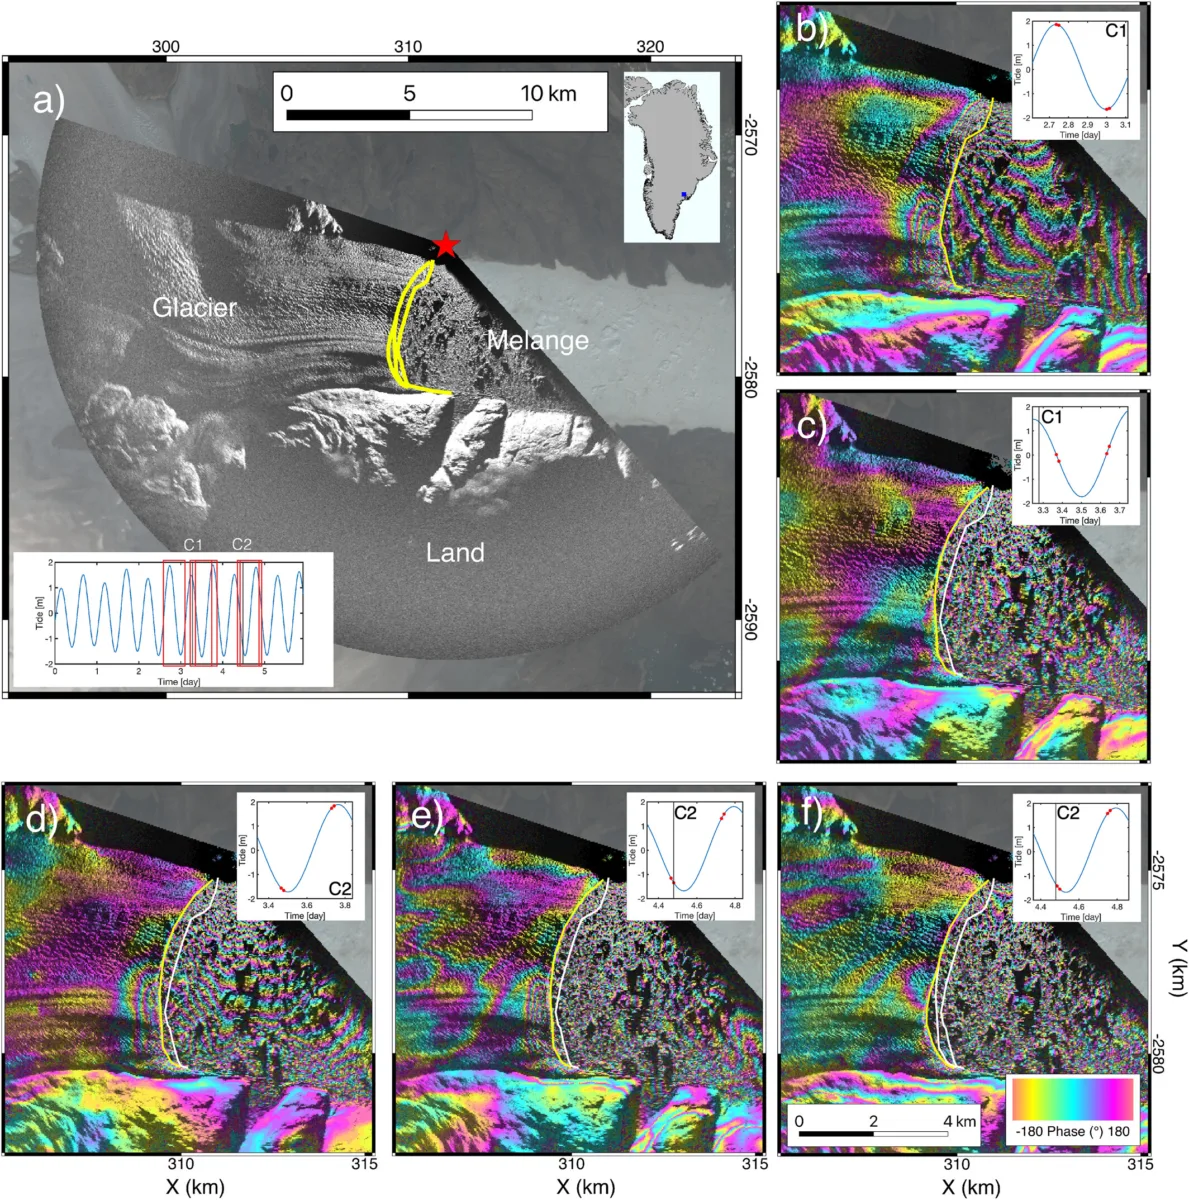
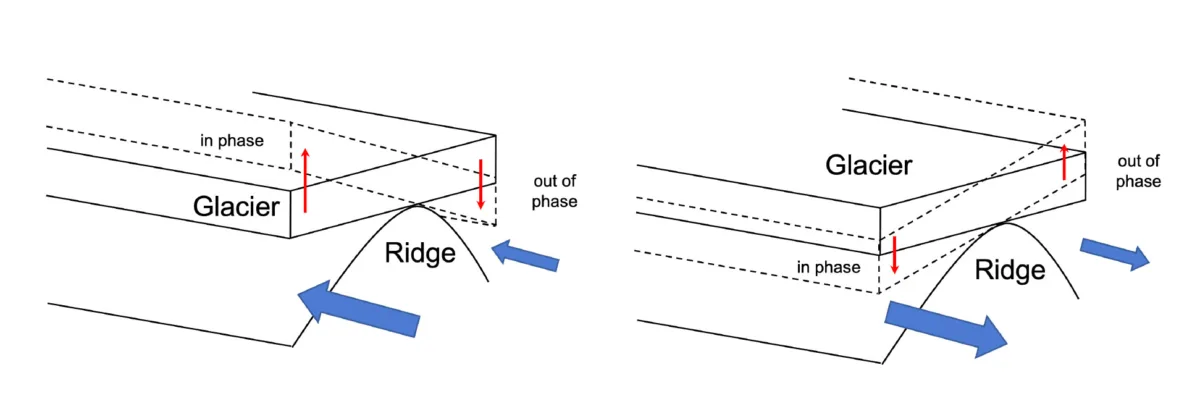
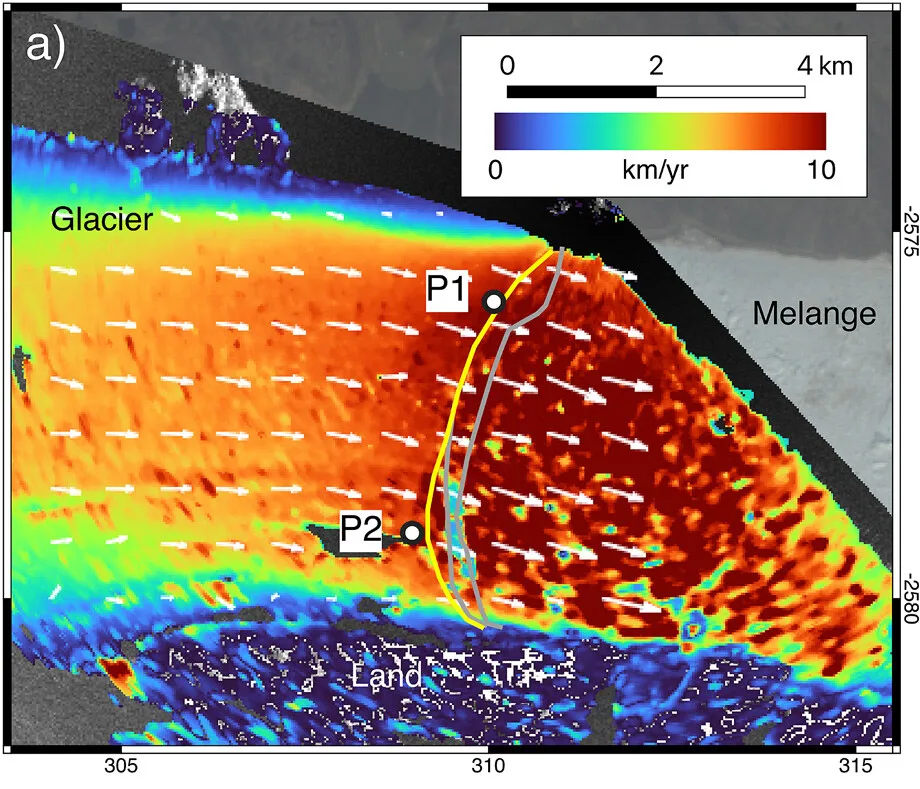
Two large fractures of the ice front were recorded that produced sheet-like icebergs about 2.5 kilometers long and 100 – 250 meters wide. By comparing the cyclical nature of the glacier’s vertical motion with the predicted tidal height from a tidal model, they determined that the glacier’s motion is in part caused by a fine balancing act upon a previously undiscovered ridge line, effectively causing a seesawing of the glacier. The side of the glacier raised up by the water intrusion is in step with the tide, but the other side doesn’t move at the same time or with the same magnitude, causing the ice to flex around the ridge. This seesawing causes the grounding line to migrate upstream and downstream as the ice rolls forward or peels back.
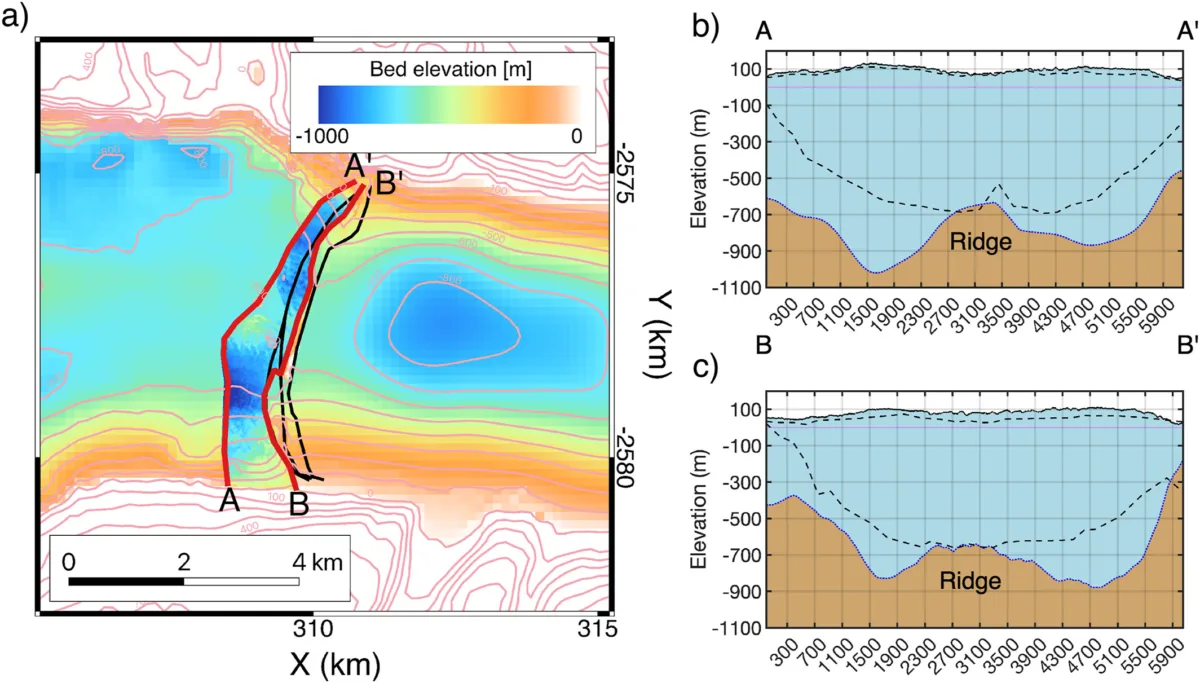
TRI measurement also reveals the speed of the glacier—and it’s fast. Helheim slides toward the water at about 20 meters per day, producing a floating ice front on the other side of the previously hidden ridge that typically grows to about 800 meters wide before it fractures into large icebergs due to tidal flexing caused by water intrusion.
This seesawing motion is a critical discovery for Helheim. The periodic pumping of seawater into the basal layer of the glacier is a driver for glacial melting. TRI measurements of Helheim allow researchers to calculate a melt rate and to contextualize this process over the course of hours and days—an unprecedented insight not possible with orbiting remote sensing technology. With TRI, researchers learned that the area of water intrusion underneath the ice can grow up to nearly 4 square kilometers in just 6 hours, resulting in approximately 90 to 140 cubic meters per second of seawater injected beneath the ice, causing Helheim to slide even more quickly into the ocean.
Even more insightful, these TRI measurements allow for insights into the enhanced melting of Helheim driven by this tidal intrusion. Between 0.5 and 0.8 meters of ice could melt from underneath Helheim per day.
Quantifying this process is key to assessing how the movement of the ice can amplify the sea level rise. In a warming ocean, increased melting could potentially drive this calving process to an extreme. Such detailed measurements of glaciers like Helheim allow for detection of very small movements that can reveal much larger processes, which can ultimately help build out more complex glacier models that seek to understand how glaciers like Helheim react to a rapidly changing Earth system.